

Question: 3. The graph below shows the conversion for a free radical polymerization reaction as a function of time conducted in the bulk. a. Draw on
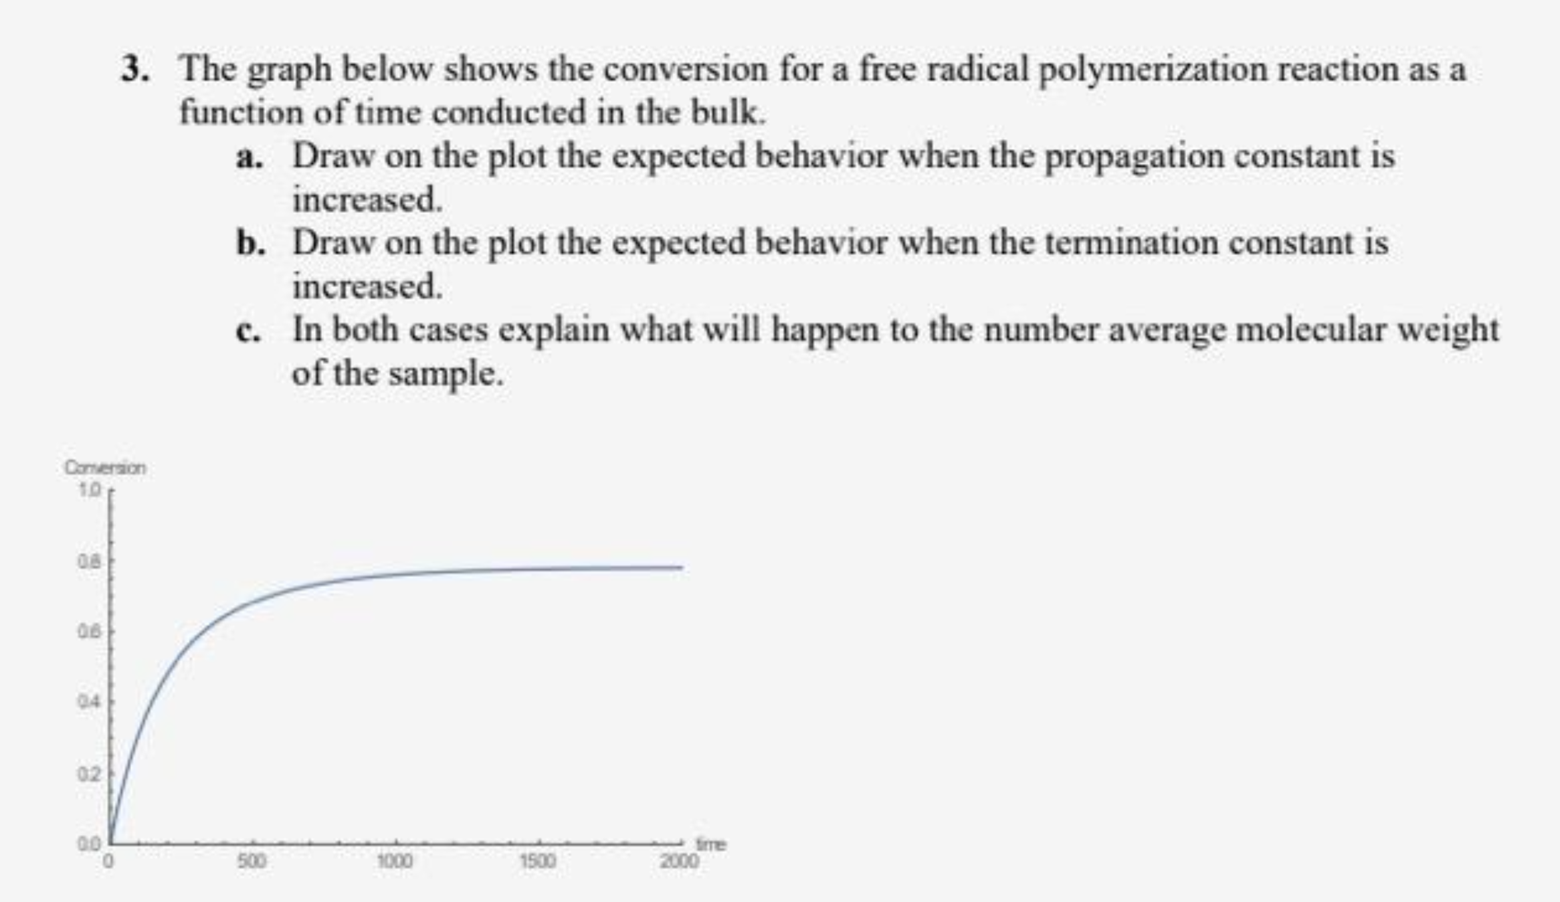
3. The graph below shows the conversion for a free radical polymerization reaction as a function of time conducted in the bulk. a. Draw on the plot the expected behavior when the propagation constant is increased. b. Draw on the plot the expected behavior when the termination constant is increased. c. In both cases explain what will happen to the number average molecular weight of the sample
Step by Step Solution
There are 3 Steps involved in it
1 Expert Approved Answer
Step: 1 Unlock

Question Has Been Solved by an Expert!
Get step-by-step solutions from verified subject matter experts
Step: 2 Unlock
Step: 3 Unlock