

Question: 3. The input (s) shown in the figure below represents noise in the sensor that corrupts the output signal X(s). If this sensor noise is
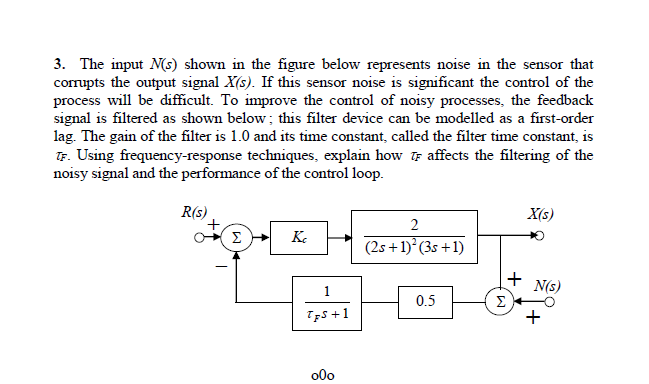
3. The input (s) shown in the figure below represents noise in the sensor that corrupts the output signal X(s). If this sensor noise is significant the control of the process will be difficult. To improve the control of noisy processes, the feedback signal is filtered as shown below; this filter device can be modelled as a first-order lag. The gain of the filter is 1.0 and its time constant, called the filter time constant, is Ts. Using frequency-response techniques, explain how ts affects the filtering of the noisy signal and the performance of the control loop. X(s) R(s) Kc 2 (2s +1) (3s +1) + N(S) 1 0.5 Tp5+1 + o0o
Step by Step Solution
There are 3 Steps involved in it
1 Expert Approved Answer
Step: 1 Unlock

Question Has Been Solved by an Expert!
Get step-by-step solutions from verified subject matter experts
Step: 2 Unlock
Step: 3 Unlock