

Question: 3. The open-loop frequency response of a voltage control system with the gain, K-1 was predicted from circuit simulations and results are presented in Table
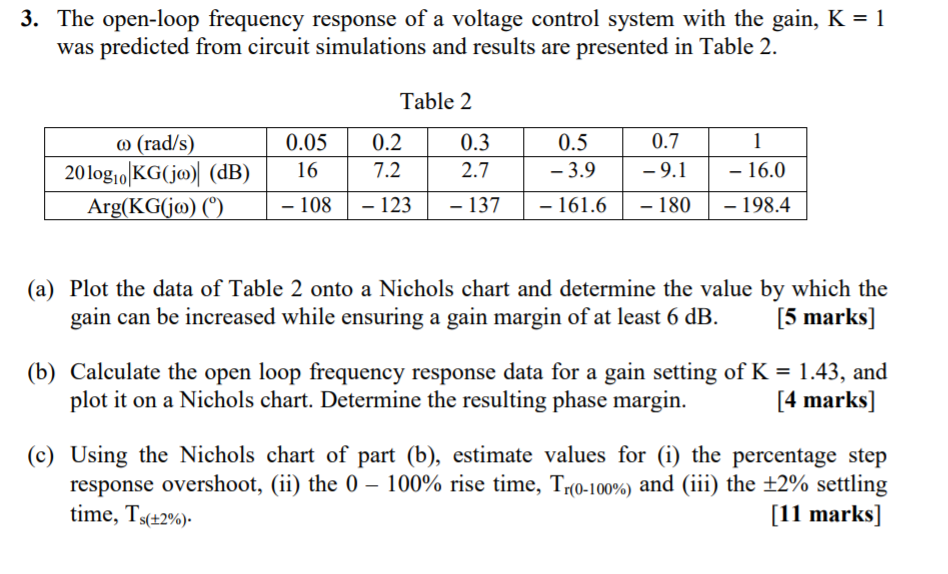
3. The open-loop frequency response of a voltage control system with the gain, K-1 was predicted from circuit simulations and results are presented in Table 2. Table 2 (rad/s) 0.05 0.2 0.3 0.5 0.7 20log oKG(jo dB) 167.22.7-3.9-9.1-16.0 -198.4 -108-1- 123 137 161.6 -180 (a) Plot the data of Table 2 onto a Nichols chart and determine the value by which the [5 marks] gain can be increased while ensuring a gain margin of at least 6 dB. (b) Calculate the open loop frequency response data for a gain setting of K = 1.43, and [4 marks] plot it on a Nichols chart. Determine the resulting phase margin. (c) Using the Nichols chart of part (b), estimate values for (i) the percentage step response overshoot, (ii) the 0-100% rise time, Tr(0-100%) and (iii) the 2% settling [11 marks] time, Ts(2%). 3. The open-loop frequency response of a voltage control system with the gain, K-1 was predicted from circuit simulations and results are presented in Table 2. Table 2 (rad/s) 0.05 0.2 0.3 0.5 0.7 20log oKG(jo dB) 167.22.7-3.9-9.1-16.0 -198.4 -108-1- 123 137 161.6 -180 (a) Plot the data of Table 2 onto a Nichols chart and determine the value by which the [5 marks] gain can be increased while ensuring a gain margin of at least 6 dB. (b) Calculate the open loop frequency response data for a gain setting of K = 1.43, and [4 marks] plot it on a Nichols chart. Determine the resulting phase margin. (c) Using the Nichols chart of part (b), estimate values for (i) the percentage step response overshoot, (ii) the 0-100% rise time, Tr(0-100%) and (iii) the 2% settling [11 marks] time, Ts(2%)
Step by Step Solution
There are 3 Steps involved in it

Get step-by-step solutions from verified subject matter experts