

Question: 3. The script EGA118_M2_Q3.m is trying to plot how the position of a ball changes subject to gravity and drag. The inclusion of drag
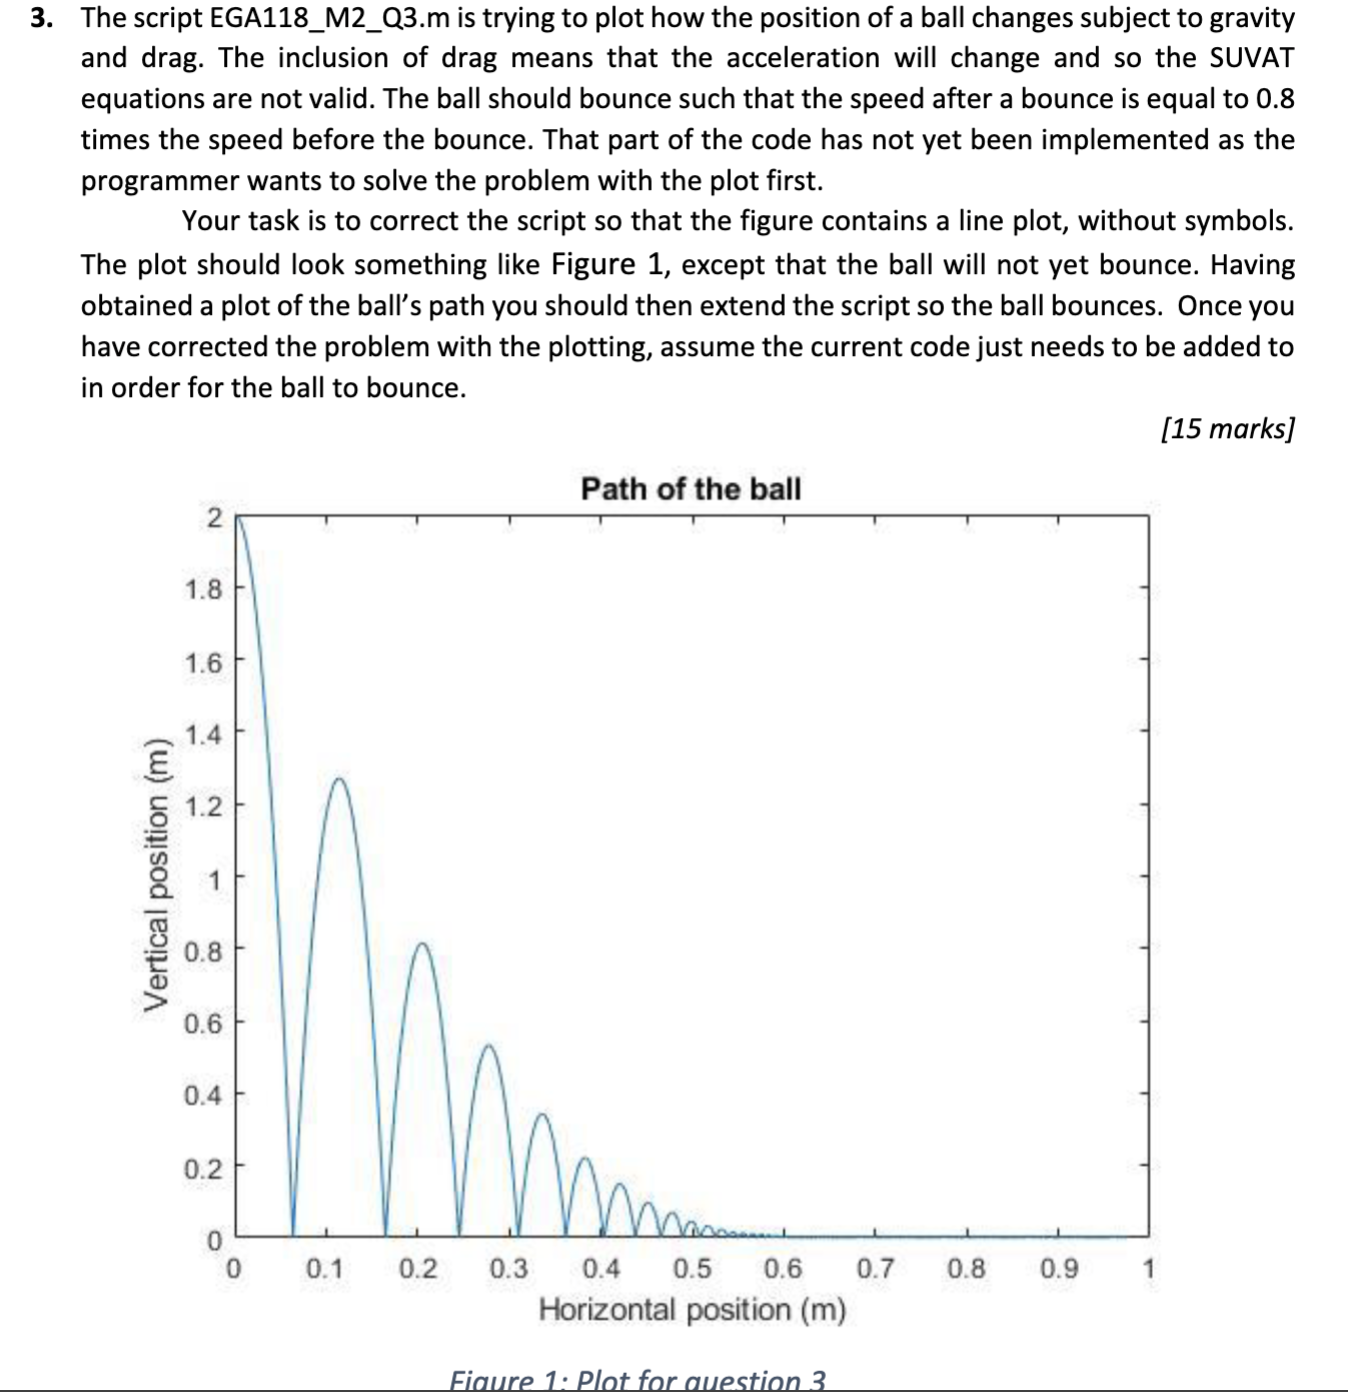
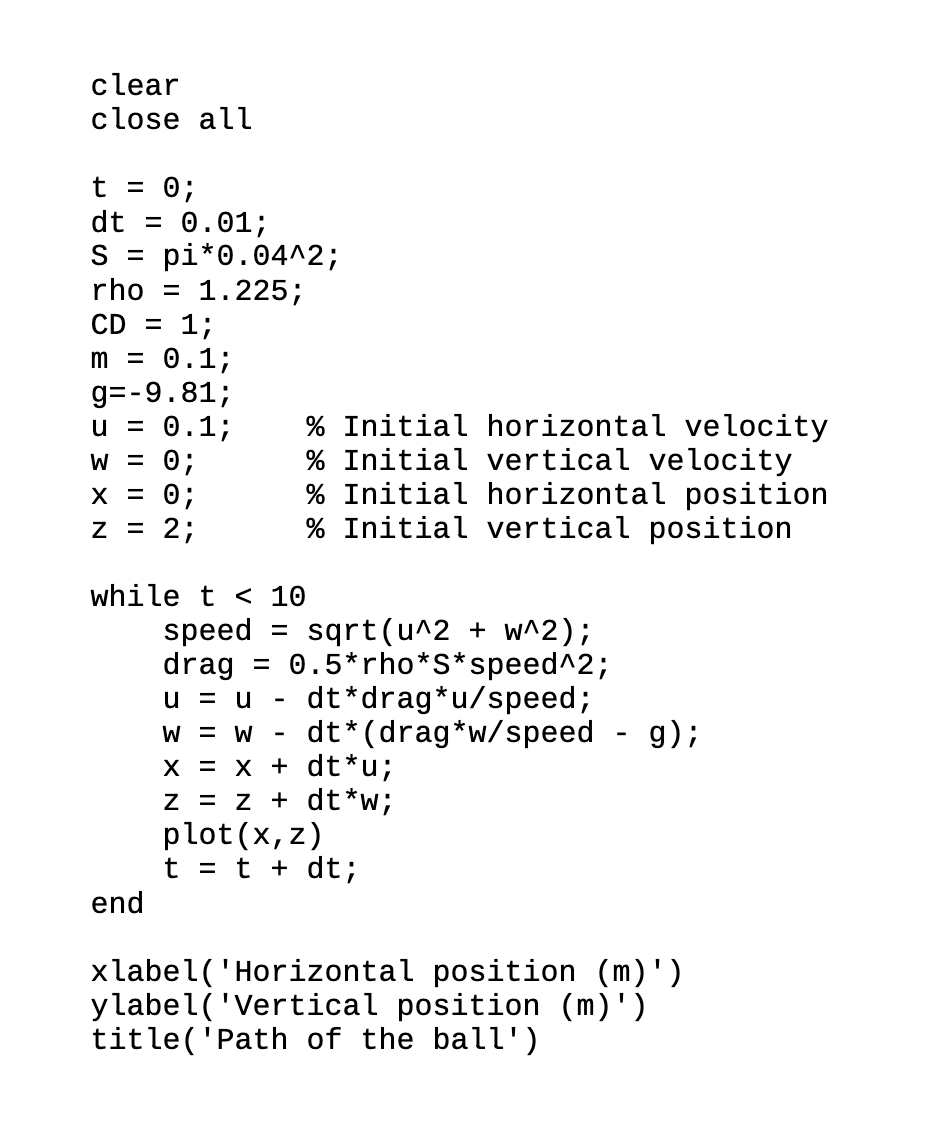
3. The script EGA118_M2_Q3.m is trying to plot how the position of a ball changes subject to gravity and drag. The inclusion of drag means that the acceleration will change and so the SUVAT equations are not valid. The ball should bounce such that the speed after a bounce is equal to 0.8 times the speed before the bounce. That part of the code has not yet been implemented as the programmer wants to solve the problem with the plot first. Your task is to correct the script so that the figure contains a line plot, without symbols. The plot should look something like Figure 1, except that the ball will not yet bounce. Having obtained a plot of the ball's path you should then extend the script so the ball bounces. Once you have corrected the problem with the plotting, assume the current code just needs to be added to in order for the ball to bounce. Vertical position (m) 1.8 1.6 1.4 12 1.2 0.8 0.6 0.4 0.2 2 T Path of the ball 0 0 0.1 0.2 0.3 0.4 0.5 0.6 Horizontal position (m) Figure 1: Plot for question 3 0.7 0.8 0.9 1 [15 marks] clear close all t = 0; dt = 0.01; S = pi*0.04^2; rho = 1.225; CD = 1; m = 0.1; g=-9.81; u = 0.1; W = 0 ; X = 0 Z = 2; while t < 10 % Initial horizontal velocity % Initial vertical velocity % Initial horizontal position % Initial vertical position speed = sqrt(u^2 + w^2); drag = 0.5*rho*S*speed^2; u = u W = W - - x = x + dt*drag*u/speed; dt (drag w/speed - g); dt*u; z = z + dt*w; plot(x, z) t = tdt; end xlabel('Horizontal position (m)') ylabel('Vertical position (m)') title('Path of the ball')
Step by Step Solution
There are 3 Steps involved in it

Get step-by-step solutions from verified subject matter experts