

Question: 3. The table below lists the resting heart rate for a group of Grade 11 students. Heart Rate Frequency 44-48 5 48-52 7 52-56
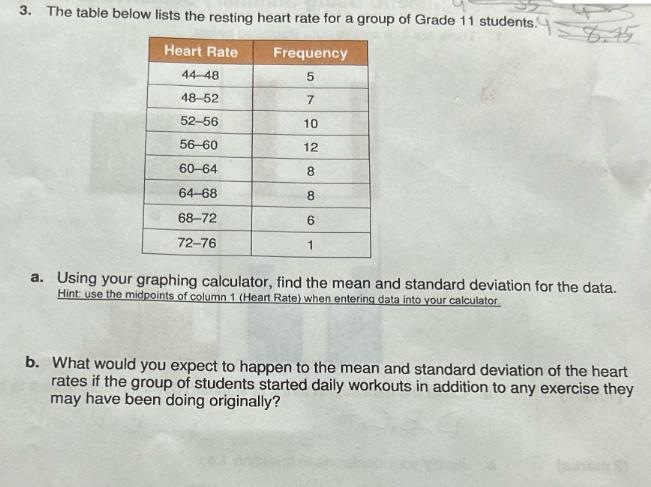
3. The table below lists the resting heart rate for a group of Grade 11 students. Heart Rate Frequency 44-48 5 48-52 7 52-56 10 56-60 12 60-64 8 64-68 8 6 1 6.45 68-72 72-76 a. Using your graphing calculator, find the mean and standard deviation for the data. Hint: use the midpoints of column 1 (Heart Rate) when entering data into your calculator b. What would you expect to happen to the mean and standard deviation of the heart rates if the group of students started daily workouts in addition to any exercise they may have been doing originally?
Step by Step Solution
There are 3 Steps involved in it
1 Expert Approved Answer
Step: 1 Unlock

Question Has Been Solved by an Expert!
Get step-by-step solutions from verified subject matter experts
Step: 2 Unlock
Step: 3 Unlock