

Question: 3. The variables below were collected for a random sample of 10 low-income neighborhoods (listed neighborhoods 1 thru 10). For each neighborhood, the researchers
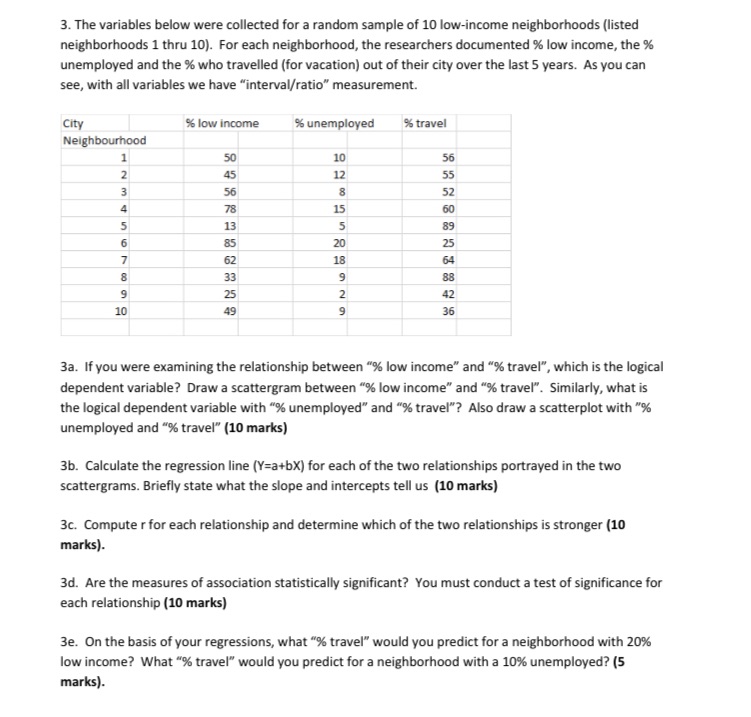
3. The variables below were collected for a random sample of 10 low-income neighborhoods (listed neighborhoods 1 thru 10). For each neighborhood, the researchers documented % low income, the % unemployed and the % who travelled (for vacation) out of their city over the last 5 years. As you can see, with all variables we have "interval/ratio" measurement. City % low income % unemployed % travel Neighbourhood 1 50 2 45 22 10 56 12 55 3 56 8 52 10 456589 78 15 60 13 5 89 85 20 25 62 18 64 33 9 88 25 2 42 49 9 36 3a. If you were examining the relationship between "% low income" and "% travel", which is the logical dependent variable? Draw a scattergram between "% low income" and "% travel". Similarly, what is the logical dependent variable with "% unemployed" and "% travel"? Also draw a scatterplot with "% unemployed and "% travel" (10 marks) 3b. Calculate the regression line (Y=a+bX) for each of the two relationships portrayed in the two scattergrams. Briefly state what the slope and intercepts tell us (10 marks) 3c. Computer for each relationship and determine which of the two relationships is stronger (10 marks). 3d. Are the measures of association statistically significant? You must conduct a test of significance for each relationship (10 marks) 3e. On the basis of your regressions, what "% travel" would you predict for a neighborhood with 20% low income? What "% travel" would you predict for a neighborhood with a 10% unemployed? (5 marks).
Step by Step Solution
There are 3 Steps involved in it

Get step-by-step solutions from verified subject matter experts