

Question: 3. The variables below were collected for a random sample of 12 London neighborhoods (listed A thru L). For each neighborhood, the researchers documented %


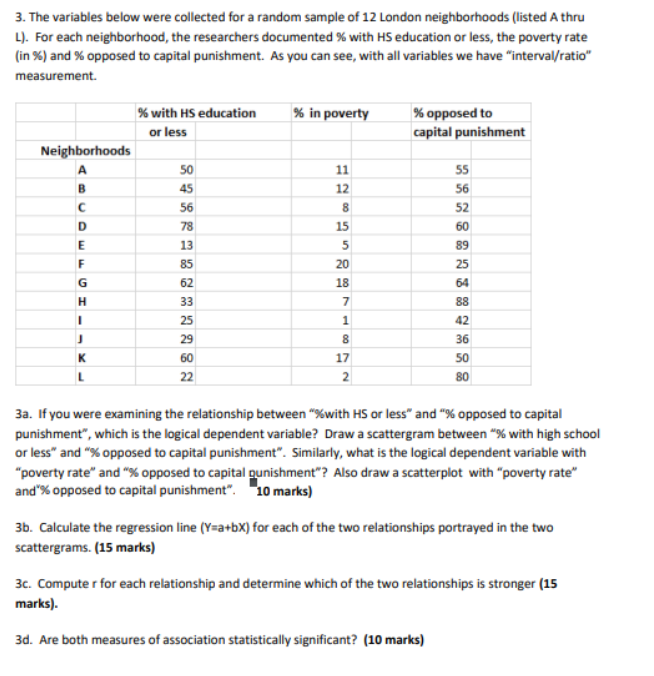
3. The variables below were collected for a random sample of 12 London neighborhoods (listed A thru L). For each neighborhood, the researchers documented % with HS education or less, the poverty rate (in %) and % opposed to capital punishment. As you can see, with all variables we have "interval/ratio" measurement. % with HS education % in poverty % opposed to capital punishment or less Neighborhoods 50 11 55 45 12 56 56 8 52 78 15 60 BIG MOOD 13 85 25 62 64 33 88 42 25 29 36 60 17 50 N BO 22 3a. If you were examining the relationship between "%with HS or less" and "% opposed to capital punishment", which is the logical dependent variable? Draw a scattergram between " with high school or less" and "% opposed to capital punishment". Similarly, what is the logical dependent variable with "poverty rate" and "% opposed to capital punishment"? Also draw a scatterplot with "poverty rate" and'%% opposed to capital punishment". "10 marks) 3b. Calculate the regression line (Y=a+bX) for each of the two relationships portrayed in the two scattergrams. (15 marks) 3c. Computer for each relationship and determine which of the two relationships is stronger (15 marks). 3d. Are both measures of association statistically significant? (10 marks)
Step by Step Solution
There are 3 Steps involved in it

Get step-by-step solutions from verified subject matter experts