

Question: 3. This question will use Excel to select random samples of varying sizes from a uniform distribution on the interval 1 to 10. The goal
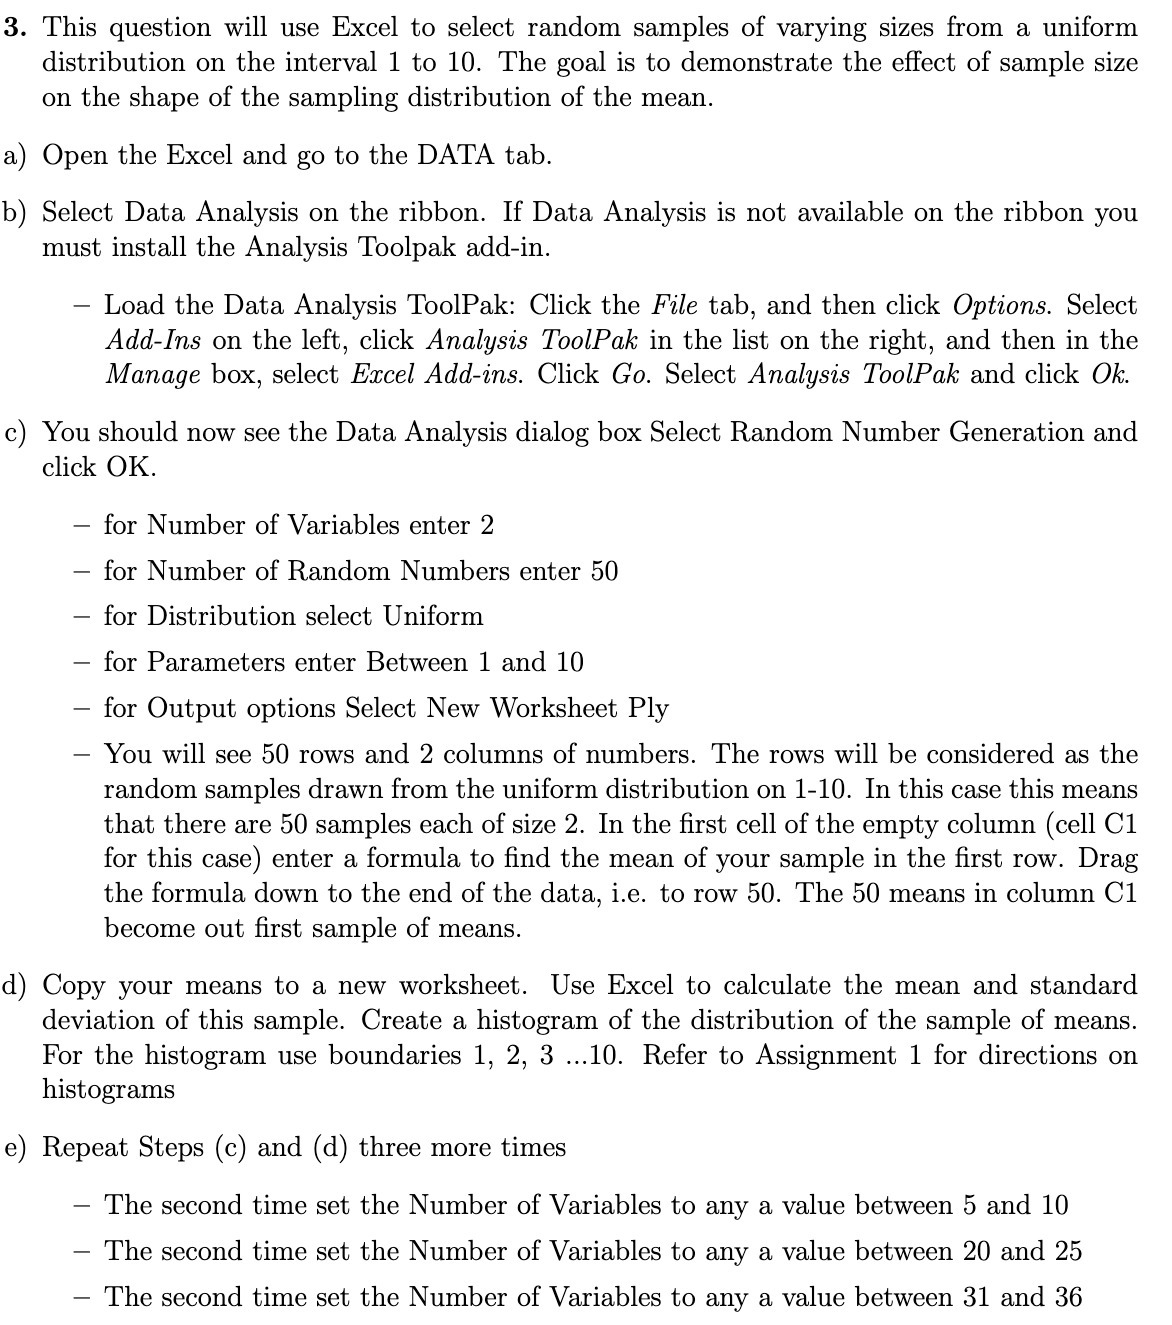
3. This question will use Excel to select random samples of varying sizes from a uniform distribution on the interval 1 to 10. The goal is to demonstrate the effect of sample size on the shape of the sampling distribution of the mean. Open the Excel and go to the DATA tab. Select Data Analysis on the ribbon. If Data Analysis is not available on the ribbon you must install the Analysis Toolpak add-in. Load the Data Analysis ToolPak: Click the F le tab, and then click Options. Select AddIns on the left, click Analysis ToolPak in the list on the right, and then in the Manage box, select Excel Add-ins. Click Go. Select Analysis ToolPak and click 016:. c) You should now see the Data Analysis dialog box Select Random Number Generation and 6) click OK. for Number of Variables enter 2 for Number of Random Numbers enter 50 for Distribution select Uniform for Parameters enter Between 1 and 10 for Output options Select New Worksheet Ply You will see 50 rows and 2 columns of numbers. The rows will be considered as the random samples drawn from the uniform distribution on 1-10. In this case this means that there are 50 samples each of size 2. In the rst cell of the empty column (cell C1 for this case) enter a formula to nd the mean of your sample in the rst row. Drag the formula down to the end of the data, i.e. to row 50. The 50 means in column C1 become out rst sample of means. Copy your means to a new worksheet. Use Excel to calculate the mean and standard deviation of this sample. Create a histogram of the distribution of the sample of means. For the histogram use boundaries 1, 2, 3 ...10. Refer to Assignment 1 for directions on histograms Repeat Steps (c) and (d) three more times The second time set the Number of Variables to any a value between 5 and 10 The second time set the Number of Variables to any a value between 20 and 25 The second time set the Number of Variables to any a value between 31 and 36
Step by Step Solution
There are 3 Steps involved in it

Get step-by-step solutions from verified subject matter experts