

Question: 3. To compute P-values, we compute a test statistic, plot the statistic on a distribution and compute an area which represents a probability. Use
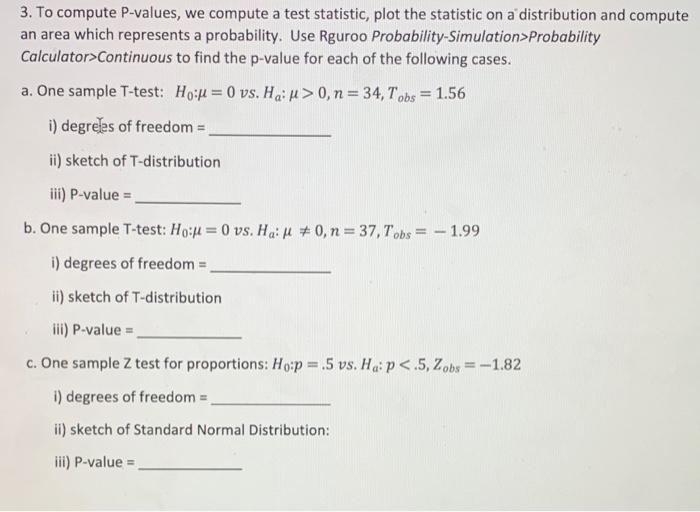
3. To compute P-values, we compute a test statistic, plot the statistic on a distribution and compute an area which represents a probability. Use Rguroo Probability-Simulation>Probability Calculator>Continuous to find the p-value for each of the following cases. a. One sample T-test: Ho = 0 vs. Ha > 0, n = 34, Tobs = 1.56 i) degrees of freedom = ii) sketch of T-distribution iii) P-value= b. One sample T-test: Ho:=0 vs. Ha: 0,n = 37, Tobs = -1.99 i) degrees of freedom = ii) sketch of T-distribution iii) P-value= c. One sample Z test for proportions: Ho:p = .5 vs. Ha: p
Step by Step Solution
There are 3 Steps involved in it

Get step-by-step solutions from verified subject matter experts