

Question: 3. Use Chapter 9. Figure 5 to answer: Looking at January of each year, how many instances were there of a decrease in job openings?
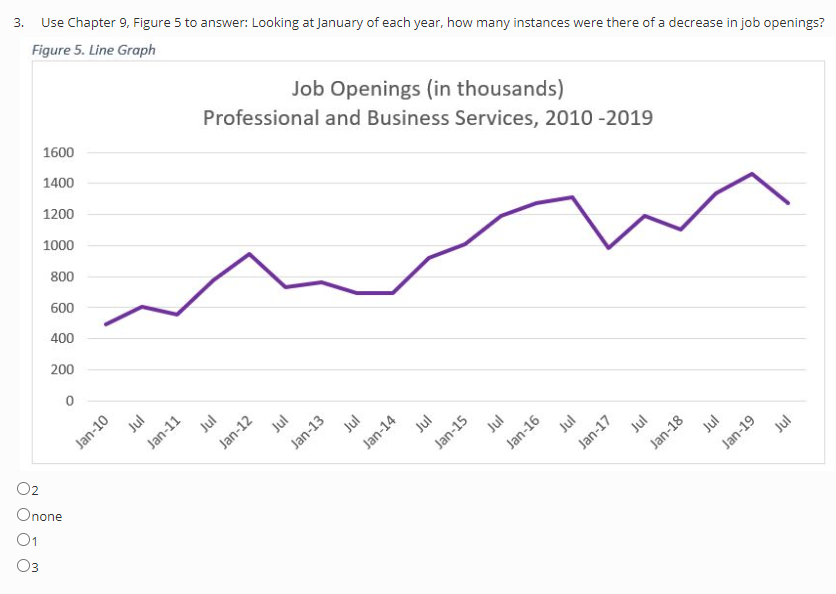
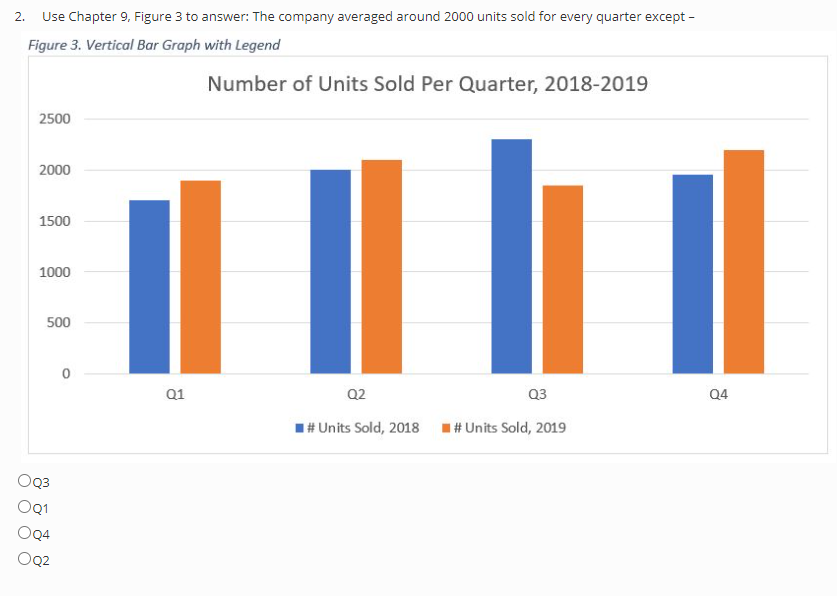
3. Use Chapter 9. Figure 5 to answer: Looking at January of each year, how many instances were there of a decrease in job openings? Figure 5. Line Graph Job Openings (in thousands) Professional and Business Services, 2010-2019 1600 1400 1200 1000 800 600 400 200 0 Jul inr Jul inr Jul Jan-10 Jul Jul Jan-11 Jan-12 Jan-13 Jul Jan-14 Jan-15 Jul Jan-16 Jan-17 Jan-18 Jul Jan-19 O2 Onone 01 2. Use Chapter 9, Figure 3 to answer: The company averaged around 2000 units sold for every quarter except - Figure 3. Vertical Bar Graph with Legend Number of Units Sold Per Quarter, 2018-2019 2500 2000 1500 1000 1 u 500 0 Q1 Q4 Q2 Q3 #Units Sold, 2018 #Units Sold, 2019 OQ3 001 O24 OQ2
Step by Step Solution
There are 3 Steps involved in it

Get step-by-step solutions from verified subject matter experts