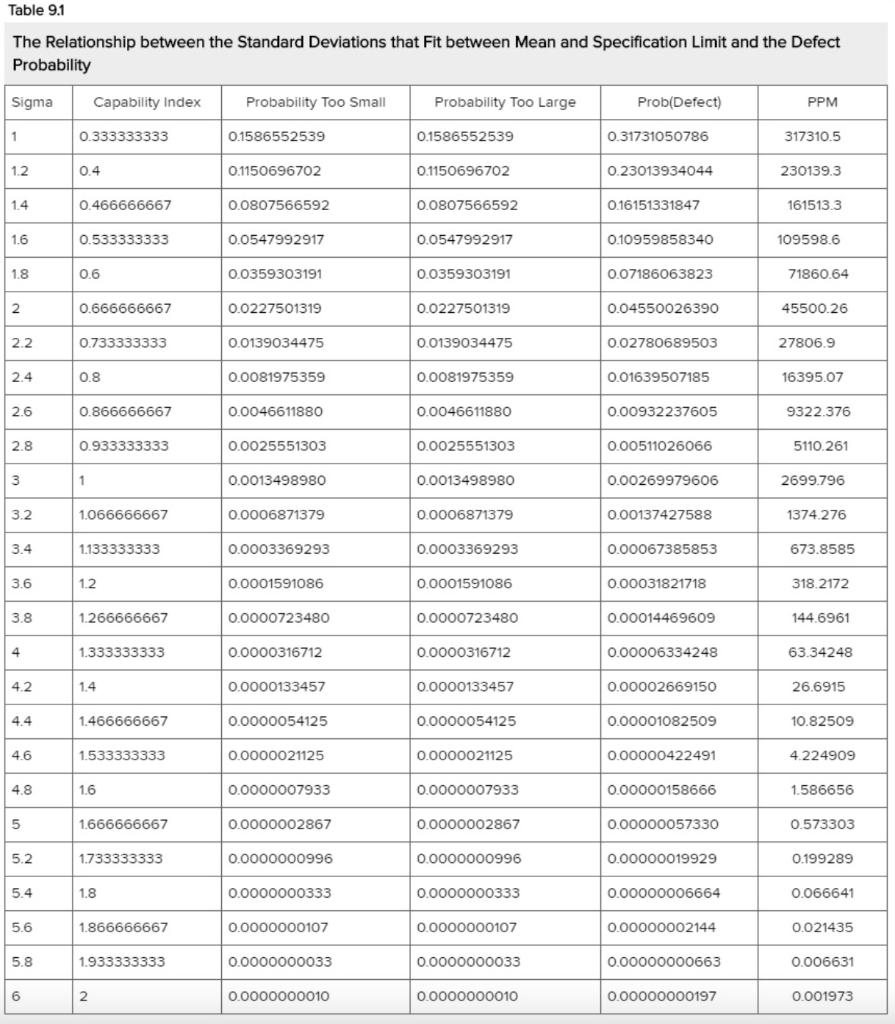
Question: 3. Use Table 9.1 to solve the... Use Table 9.1 (OR ANY VALID TECHNIQUE) to solve the problem. Consider again that the company making tires

3. Use Table 9.1 to solve the... Use Table 9.13. Use Table 9.1 to solve the... Use Table 9.1

3. Use Table 9.1 to solve the... Use Table 9.1 (OR ANY VALID TECHNIQUE) to solve the problem. Consider again that the company making tires for bikes is concerned about the exact width of its cyclocross tires. The information is the same as in #1 above. To what level would it have to reduce the standard deviation in the process to meet a defect target of 1%, as opposed to the defect result in 2c above? ANSWER 4. For... For 100 consecutive days, a process engineer has measured the temperature of champagne bottles as they are made ready for serving. Each day, she took a sample of 10 bottles. The average across all 1000 bottles (100 days, 10 bottles per day) was 45 degrees Fahrenheit. The standard deviation across all bottles was 0.7 degree. Round your final answer to 4 decimal places.) When constructing an X-bar chart, what would be the upper control limit? ANSWER Table 9.1 The Relationship between the Standard Deviations that Fit between Mean and Specification Limit and the Defect Probability

Step by Step Solution

There are 3 Steps involved in it

1 Expert Approved Answer
Step: 1 Unlock blur-text-image
Question Has Been Solved by an Expert!

Get step-by-step solutions from verified subject matter experts

Step: 2 Unlock
Step: 3 Unlock

Students Have Also Explored These Related General Management Questions!