

Question: 3. Use the scatterplot shown in Figure 3 to answer this question. 2 Figure 3: Figure for Question 3 Scatterplot 080000 a 8 08
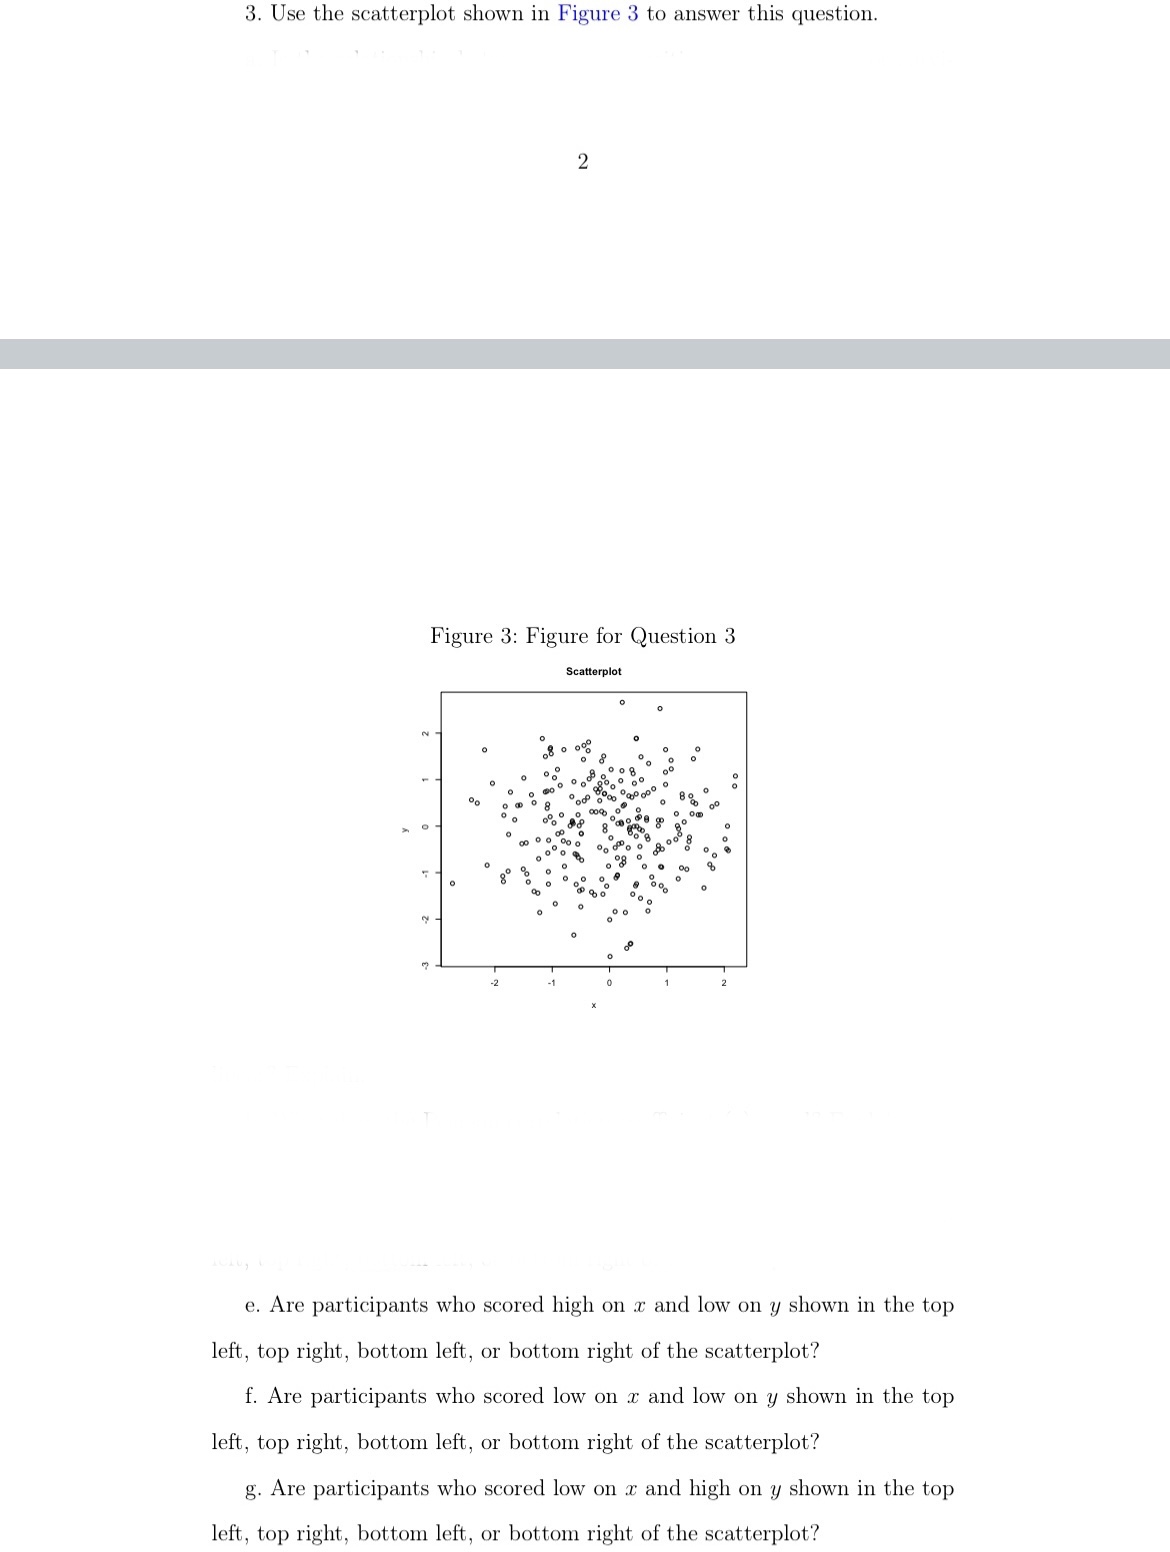
3. Use the scatterplot shown in Figure 3 to answer this question. 2 Figure 3: Figure for Question 3 Scatterplot 080000 a 8 08 008 90 8 000.00 00 0 00 0% e. Are participants who scored high on x and low on y shown in the top left, top right, bottom left, or bottom right of the scatterplot? f. Are participants who scored low on x and low on y shown in the top left, top right, bottom left, or bottom right of the scatterplot? g. Are participants who scored low on x and high on y shown in the top left, top right, bottom left, or bottom right of the scatterplot?
Step by Step Solution
There are 3 Steps involved in it
1 Expert Approved Answer
Step: 1 Unlock

Question Has Been Solved by an Expert!
Get step-by-step solutions from verified subject matter experts
Step: 2 Unlock
Step: 3 Unlock