

Question: 3. Using a pivot table , determine which of the following statements is incorrect about the average age of respondents in each age category. a.

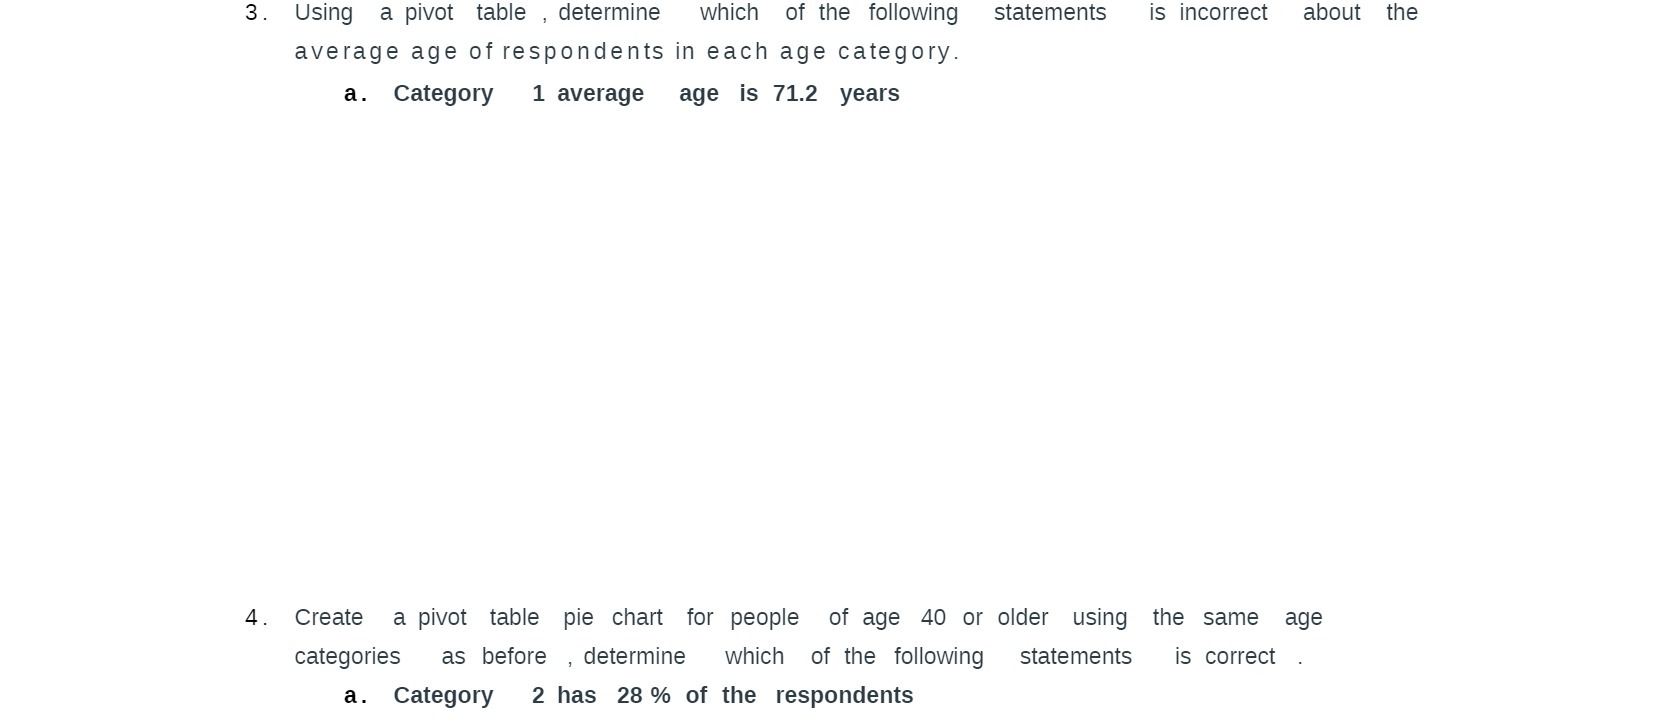
3. Using a pivot table , determine which of the following statements is incorrect about the average age of respondents in each age category. a. Category 1 average age is 71.2 years 4. Create a pivot table pie chart for people of age 40 or older using the same age categories as before ,determine which of the following statements is correct a. Category 2 has 28% of the respondents
Step by Step Solution
There are 3 Steps involved in it
1 Expert Approved Answer
Step: 1 Unlock

Question Has Been Solved by an Expert!
Get step-by-step solutions from verified subject matter experts
Step: 2 Unlock
Step: 3 Unlock