

Question: 3- Using Data in the table below. a) Calculate the mole fractions of urea and cinnamic acid in the five samples. Record the results in
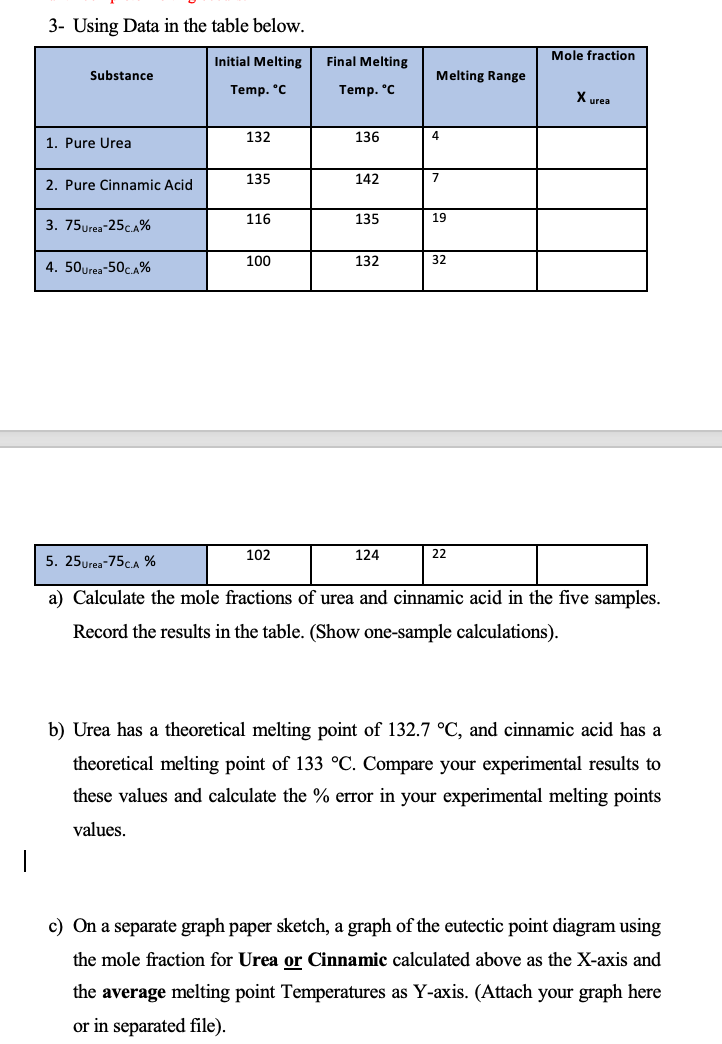
3- Using Data in the table below. a) Calculate the mole fractions of urea and cinnamic acid in the five samples. Record the results in the table. (Show one-sample calculations). b) Urea has a theoretical melting point of 132.7C, and cinnamic acid has a theoretical melting point of 133C. Compare your experimental results to these values and calculate the % error in your experimental melting points values. c) On a separate graph paper sketch, a graph of the eutectic point diagram using the mole fraction for Urea or Cinnamic calculated above as the X-axis and the average melting point Temperatures as Y-axis. (Attach your graph here or in separated file). 3- Using Data in the table below. a) Calculate the mole fractions of urea and cinnamic acid in the five samples. Record the results in the table. (Show one-sample calculations). b) Urea has a theoretical melting point of 132.7C, and cinnamic acid has a theoretical melting point of 133C. Compare your experimental results to these values and calculate the % error in your experimental melting points values. c) On a separate graph paper sketch, a graph of the eutectic point diagram using the mole fraction for Urea or Cinnamic calculated above as the X-axis and the average melting point Temperatures as Y-axis. (Attach your graph here or in separated file)
Step by Step Solution
There are 3 Steps involved in it

Get step-by-step solutions from verified subject matter experts