

Question: 3) Using the historical returns provided in Table 1, calculate the 1-year trailing, annualized beta and alpha for each stock using SPY as the
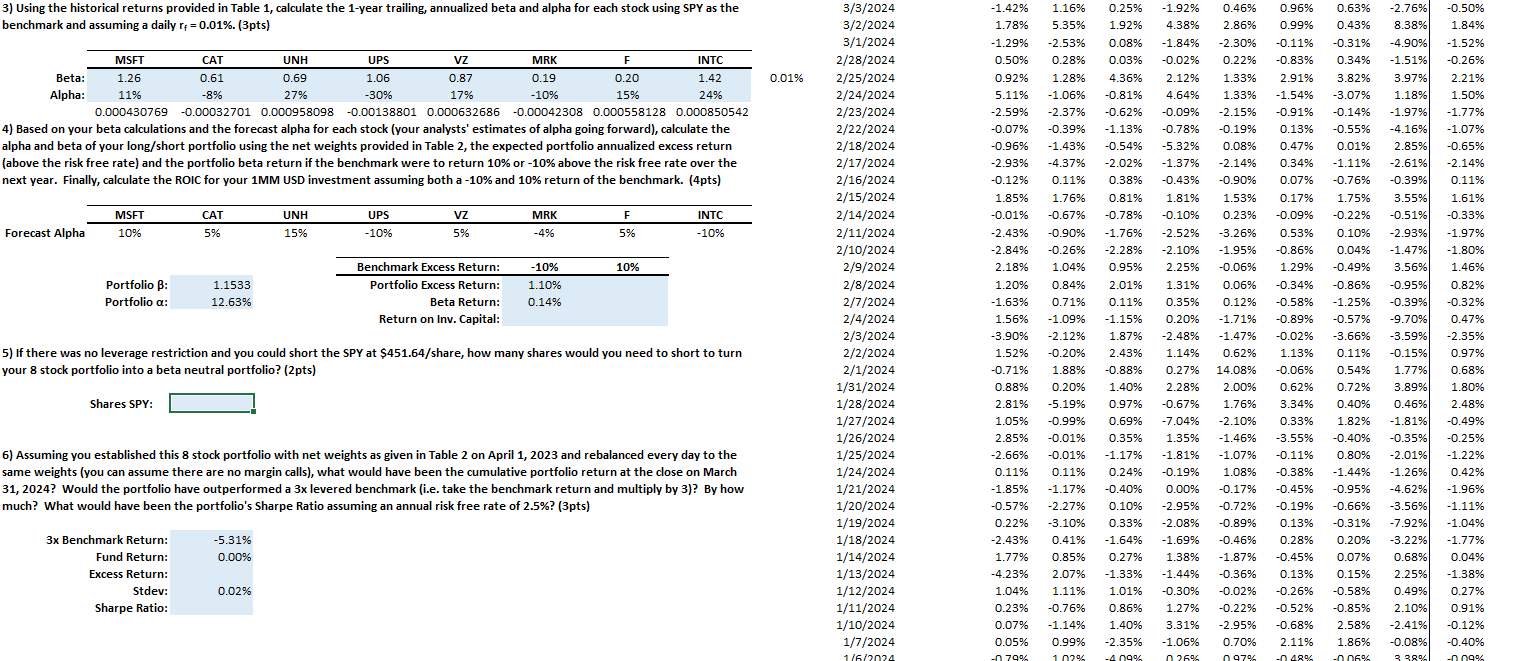
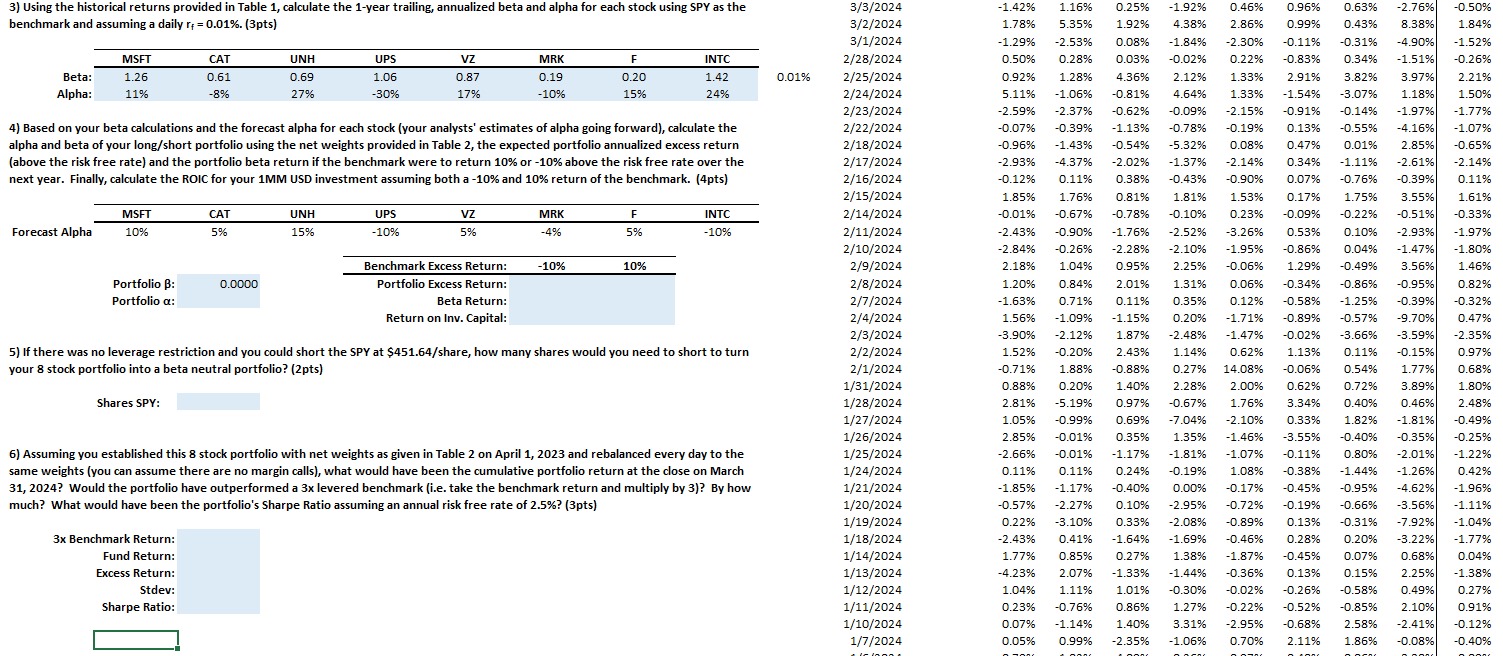
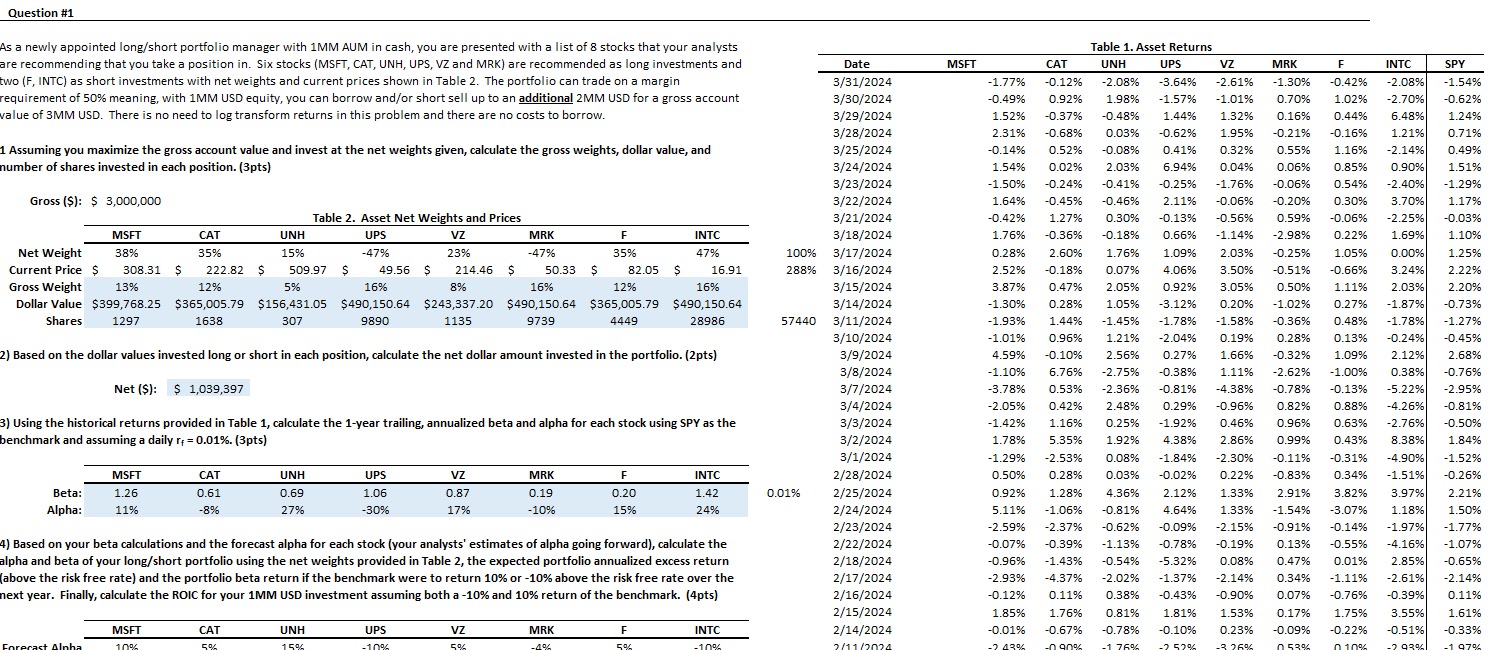
3) Using the historical returns provided in Table 1, calculate the 1-year trailing, annualized beta and alpha for each stock using SPY as the benchmark and assuming a daily r+ = 0.01%. (3pts) MSFT CAT UNH UPS Vz MRK F INTC Beta: 1.26 0.61 0.69 Alpha: 11% -8% 27% 1.06 -30% 0.87 0.19 0.20 1.42 0.01% 17% -10% 15% 24% 0.000430769 -0.00032701 0.000958098 -0.00138801 0.000632686 -0.00042308 0.000558128 0.000850542 4) Based on your beta calculations and the forecast alpha for each stock (your analysts' estimates of alpha going forward), calculate the alpha and beta of your long/short portfolio using the net weights provided in Table 2, the expected portfolio annualized excess return (above the risk free rate) and the portfolio beta return if the benchmark were to return 10% or -10% above the risk free rate over the next year. Finally, calculate the ROIC for your 1MM USD investment assuming both a -10% and 10% return of the benchmark. (4pts) 3/3/2024 3/2/2024 3/1/2024 2/28/2024 2/25/2024 2/24/2024 2/23/2024 2/22/2024 2/18/2024 Forecast Alpha MSFT 10% CAT 5% UNH 15% UPS -10% VZ 5% MRK F -4% 5% INTC -10% 2/17/2024 2/16/2024 2/15/2024 2/14/2024 2/11/2024 Portfolio : Portfolio a: 1.1533 12.63% Benchmark Excess Return: Portfolio Excess Return: -10% 1.10% 10% Beta Return: Return on Inv. Capital: 0.14% 2/10/2024 2/9/2024 2/8/2024 2/7/2024 2/4/2024 2/3/2024 5) If there was no leverage restriction and you could short the SPY at $451.64/share, how many shares would you need to short to turn your 8 stock portfolio into a beta neutral portfolio? (2pts) 2/2/2024 2/1/2024 Shares SPY: 1/31/2024 1/28/2024 1/27/2024 1/26/2024 0.35% 6) Assuming you established this 8 stock portfolio with net weights as given in Table 2 on April 1, 2023 and rebalanced every day to the same weights (you can assume there are no margin calls), what would have been the cumulative portfolio return at the close on March 31, 2024? Would the portfolio have outperformed a 3x levered benchmark (i.e. take the benchmark return and multiply by 3)? By how much? What would have been the portfolio's Sharpe Ratio assuming an annual risk free rate of 2.5%? (3pts) 1/25/2024 1/24/2024 1/21/2024 1/20/2024 1/19/2024 3x Benchmark Return: Fund Return: -5.31% 0.00% 1/18/2024 1/14/2024 Excess Return: 1/13/2024 Stdev: 0.02% Sharpe Ratio: 1/12/2024 1/11/2024 1/10/2024 1/7/2024 1/6/2024 -1.42% 1.16% 0.25% -1.92% 0.63% -2.76% -0.50% 1.78% 5.35% 1.92% 8.38% 1.84% -1.29% -2.53% 0.08% -1.84% -2.30% -0.11% -0.31% -4.90% -1.52% 0.50% 0.28% 0.03% -0.02% 0.22% -0.83% 0.34% -1.51% -0.26% 0.92% 1.28% 4.36% 2.12% 1.33% 2.91% 3.82% 3.97% 2.21% 5.11% -1.06% -0.81% 4.64% 1.33% -1.54% -3.07% 1.18% 1.50% -2.59% -2.37% -0.62% -0.09% -2.15% -0.91% -0.14% -1.97% -1.77% -0.07% -0.39% -1.13% -0.78% -0.19% 0.13% -0.55% -4.16% -1.07% -0.96% -1.43% -0.54% -5.32% 0.08% 0.47% 0.01% 2.85% -0.65% -2.93% -4.37% -2.02% -1.37% -2.14% 0.34% -1.11% -2.61% -2.14% -0.12% 0.11% 0.38% -0.43% -0.90% 0.07% -0.76% -0.39% 0.11% 1.85% 1.76% 0.81% 1.81% 1.53% 0.17% 1.75% 3.55% 1.61% -0.01% -0.67% -0.78% -0.10% 0.23% -0.09% -0.22% -0.51% -0.33% -2.43% -0.90% -1.76% -2.52% -3.26% 0.53% 0.10% -2.93% -1.97% -2.84% -0.26% -2.28% -2.10% -1.95% -0.86% 0.04% -1.47% -1.80% 2.18% 1.04% 0.95% 2.25% -0.06% 1.29% -0.49% 3.56% 1.46% 1.20% 0.84% 2.01% 1.31% 0.06% -0.34% -0.86% -0.95% 0.82% -1.63% 0.71% 0.11% 0.35% 0.12% -0.58% -1.25% -0.39% -0.32% 1.56% -1.09% -1.15% 0.20% -1.71% -0.89% -0.57% -9.70% 0.47% -3.90% -2.12% 1.87% -2.48% -1.47% -0.02% -3.66% -3.59% -2.35% 1.52% -0.20% 2.43% 1.14% 0.62% 1.13% 0.11% -0.15% 0.97% -0.71% 1.88% -0.88% 0.27% 14.08% -0.06% 0.54% 1.77% 0.68% 0.88% 0.20% 1.40% 2.28% 2.00% 0.62% 0.72% 3.89% 1.80% 2.81% -5.19% 0.97% -0.67% 1.76% 3.34% 0.40% 0.46% 2.48% 1.05% -0.99% 0.69% -7.04% -2.10% 0.33% 1.82% -1.81% -0.49% 2.85% -0.01% 1.35% -1.46% -3.55% -0.40% -0.35% -0.25% -2.66% -0.01% -1.17% -1.81% -1.07% -0.11% 0.80% -2.01% -1.22% 0.11% 0.11% 0.24% -0.19% 1.08% -0.38% -1.44% -1.26% 0.42% -1.85% -1.17% -0.40% 0.00% -0.17% -0.45% -0.95% -4.62% -1.96% -0.57% -2.27% 0.10% -2.95% -0.72% -0.19% -0.66% -3.56% -1.11% 0.22% -3.10% 0.33% -2.08% -0.89% 0.13% -0.31% -7.92% -1.04% -2.43% 0.41% -1.64% -1.69% -0.46% 0.28% 0.20% -3.22% -1.77% 1.77% 0.85% 0.27% 1.38% -1.87% -0.45% 0.07% 0.68% 0.04% -4.23% 2.07% -1.33% -1.44% -0.36% 0.13% 0.15% 2.25% -1.38% 1.04% 1.11% 1.01% -0.30% -0.02% -0.26% -0.58% 0.49% 0.27% 0.23% -0.76% 0.86% 1.27% -0.22% -0.52% -0.85% 2.10% 0.91% 0.07% -1.14% 1.40% 3.31% -2.95% -0.68% 2.58% -2.41% -0.12% 0.05% 0.99% -2.35% -1.06% 0.70% 2.11% 1.86% -0.08% -0.40% -0.79% 1.02% -4.09% 0.26% 0.97% -0.48% -0.06% 3 38% -0.09% 0.46% 0.96% 4.38% 2.86% 0.99% 0.43% 3) Using the historical returns provided in Table 1, calculate the 1-year trailing, annualized beta and alpha for each stock using SPY as the benchmark and assuming a daily r+ = 0.01%. (3pts) MSFT CAT UNH UPS VZ MRK F INTC Beta: Alpha: 1.26 11% 0.61 -8% 0.69 27% 1.06 -30% 0.87 17% 0.19 0.20 1.42 0.01% -10% 15% 24% 3/3/2024 3/2/2024 3/1/2024 2/28/2024 2/25/2024 2/24/2024 2/23/2024 4) Based on your beta calculations and the forecast alpha for each stock (your analysts' estimates of alpha going forward), calculate the alpha and beta of your long/short portfolio using the net weights provided in Table 2, the expected portfolio annualized excess return (above the risk free rate) and the portfolio beta return if the benchmark were to return 10% or -10% above the risk free rate over the next year. Finally, calculate the ROIC for your 1MM USD investment assuming both a -10% and 10% return of the benchmark. (4pts) 2/22/2024 2/18/2024 2/17/2024 2/16/2024 2/15/2024 MSFT CAT Forecast Alpha 10% 5% UNH 15% UPS -10% VZ 5% MRK F -4% 5% INTC -10% 2/14/2024 2/11/2024 2/10/2024 Portfolio : Portfolio a: 0.0000 Benchmark Excess Return: Portfolio Excess Return: -10% 10% 2/9/2024 2/8/2024 Beta Return: 2/7/2024 Return on Inv. Capital: 2/4/2024 2/3/2024 5) If there was no leverage restriction and you could short the SPY at $451.64/share, how many shares would you need to short to turn your 8 stock portfolio into a beta neutral portfolio? (2pts) 2/2/2024 2/1/2024 Shares SPY: 6) Assuming you established this 8 stock portfolio with net weights as given in Table 2 on April 1, 2023 and rebalanced every day to the same weights (you can assume there are no margin calls), what would have been the cumulative portfolio return at the close on March 31, 2024? Would the portfolio have outperformed a 3x levered benchmark (i.e. take the benchmark return and multiply by 3)? By how much? What would have been the portfolio's Sharpe Ratio assuming an annual risk free rate of 2.5% ? (3pts) 3x Benchmark Return: Fund Return: Excess Return: Stdev: Sharpe Ratio: 1/31/2024 1/28/2024 1/27/2024 1/26/2024 1/25/2024 1/24/2024 1/21/2024 1/20/2024 1/19/2024 1/18/2024 1/14/2024 1/13/2024 1/12/2024 1/11/2024 1/10/2024 1/7/2024 -1.42% 1.16% 0.25% -1.92% 0.46% 0.96% 0.63% -2.76% -0.50% 1.78% 5.35% 1.92% 4.38% 2.86% 0.99% 0.43% 8.38% 1.84% -1.29% -2.53% 0.08% -1.84% -2.30% -0.11% -0.31% -4.90% -1.52% 0.50% 0.28% 0.03% -0.02% 0.22% -0.83% 0.34% -1.51% -0.26% 0.92% 1.28% 4.36% 2.12% 1.33% 2.91% 3.82% 3.97% 2.21% 5.11% -1.06% -0.81% 4.64% 1.33% -1.54% -3.07% 1.18% 1.50% -2.59% -2.37% -0.62% -0.09% -2.15% -0.91% -0.14% -1.97% -1.77% -0.07% -0.39% -1.13% -0.78% -0.19% 0.13% -0.55% -4.16% -1.07% -0.96% -1.43% -0.54% -5.32% 0.08% 0.47% 0.01% 2.85% -0.65% -2.93% -4.37% -2.02% -1.37% -2.14% 0.34% -1.11% -2.61% -2.14% -0.12% 0.11% 0.38% -0.43% -0.90% 0.07% -0.76% -0.39% 0.11% 1.85% 1.76% 0.81% 1.81% 1.53% 0.17% 1.75% 3.55% 1.61% -0.01% -0.67% -0.78% -0.10% 0.23% -0.09% -0.22% -0.51% -0.33% -2.43% -0.90% -1.76% -2.52% -3.26% 0.53% 0.10% -2.93% -1.97% -2.84% -0.26% -2.28% -2.10% -1.95% -0.86% 0.04% -1.47% -1.80% 2.18% 1.04% 0.95% 2.25% -0.06% 1.29% -0.49% 3.56% 1.46% 1.20% 0.84% 2.01% 1.31% 0.06% -0.34% -0.86% -0.95% 0.82% -1.63% 0.71% 0.11% 0.35% 0.12% -0.58% -1.25% -0.39% -0.32% 1.56% -1.09% -1.15% 0.20% -1.71% -0.89% -0.57% -9.70% 0.47% -3.90% -2.12% 1.87% -2.48% -1.47% -0.02% -3.66% -3.59% -2.35% 1.52% -0.20% 2.43% 1.14% 0.62% 1.13% 0.11% -0.15% 0.97% -0.71% 1.88% -0.88% 0.27% 14.08% -0.06% 0.54% 1.77% 0.68% 0.88% 0.20% 1.40% 2.28% 2.00% 0.62% 0.72% 3.89% 2.81% -5.19% 0.97% -0.67% 1.76% 3.34% 0.40% 0.46% 2.48% 1.05% -0.99% 0.69% -7.04% -2.10% 0.33% 1.82% -1.81% -0.49% 2.85% -0.01% 0.35% 1.35% -1.46% -3.55% -0.40% -0.35% -0.25% -2.66% -0.01% -1.17% -1.81% -1.07% -0.11% 0.80% -2.01% -1.22% 0.11% 0.11% 0.24% -0.19% 1.08% -0.38% -1.44% -1.26% 0.42% -1.85% -1.17% -0.40% 0.00% -0.17% -0.45% -0.95% -4.62% -1.96% -0.57% -2.27% 0.10% -2.95% -0.72% -0.19% -0.66% -3.56% -1.11% 0.22% -3.10% 0.33% -2.08% -0.89% 0.13% -0.31% -7.92% -1.04% -2.43% 0.41% -1.64% -1.69% -0.46% 0.28% 0.20% -3.22% -1.77% 1.77% 0.85% 0.27% 1.38% -1.87% -0.45% 0.07% 0.68% 0.04% -4.23% 2.07% -1.33% -1.44% -0.36% 0.13% 0.15% 2.25% -1.38% 1.04% 1.11% 1.01% -0.30% -0.02% -0.26% -0.58% 0.49% 0.27% 0.23% -0.76% 0.86% 1.27% -0.22% -0.52% -0.85% 2.10% 0.91% 0.07% -1.14% 1.40% 3.31% -2.95% -0.68% 2.58% -2.41% 0.05% 0.99% -2.35% -1.06% 0.70% 2.11% 1.86% -0.08% 1.80% -0.12% -0.40% Question #1 As a newly appointed long/short portfolio manager with 1MM AUM in cash, you are presented with a list of 8 stocks that your analysts are recommending that you take a position in. Six stocks (MSFT, CAT, UNH, UPS, VZ and MRK) are recommended as long investments and two (F, INTC) as short investments with net weights and current prices shown in Table 2. The portfolio can trade on a margin requirement of 50% meaning, with 1MM USD equity, you can borrow and/or short sell up to an additional 2MM USD for a gross account value of 3MM USD. There is no need to log transform returns in this problem and there are no costs to borrow. Table 1. Asset Returns Date 3/31/2024 MSFT VZ 3/30/2024 3/29/2024 3/28/2024 1 Assuming you maximize the gross account value and invest at the net weights given, calculate the gross weights, dollar value, and number of shares invested in each position. (3pts) Gross ($): $ 3,000,000 Table 2. Asset Net Weights and Prices MSFT Net Weight 38% CAT 35% UNH 15% UPS VZ MRK -47% 23% -47% F 35% INTC 47% Current Price $ Gross Weight 308.31 $ 13% 222.82 $ 12% 509.97 5% S 49.56 $ 16% 214.46 $ 8% 50.33 $ 82.05 $ 16.91 Dollar Value $399,768.25 $365,005.79 $156,431.05 $490,150.64 $243,337.20 16% $490,150.64 Shares 1297 1638 307 9890 1135 9739 12% $365,005.79 4449 16% $490,150.64 28986 57440 3/25/2024 3/24/2024 3/23/2024 3/22/2024 3/21/2024 3/18/2024 100% 3/17/2024 288% 3/16/2024 3/15/2024 3/14/2024 3/11/2024 3/10/2024 2) Based on the dollar values invested long or short in each position, calculate the net dollar amount invested in the portfolio. (2pts) 3/9/2024 Net ($): $ 1,039,397 3/8/2024 3/7/2024 3) Using the historical returns provided in Table 1, calculate the 1-year trailing, annualized beta and alpha for each stock using SPY as the benchmark and assuming a daily r = 0.01%. (3pts) MSFT CAT UNH UPS VZ MRK F INTC Beta: Alpha: 1.26 11% 0.61 -8% 0.69 27% 1.06 -30% 0.87 17% 0.19 -10% 0.20 15% 1.42 0.01% 3/4/2024 3/3/2024 3/2/2024 3/1/2024 2/28/2024 2/25/2024 CAT UNH UPS MRK INTC SPY -1.77% -0.12% -2.08% -3.64% -2.61% -1.30% -0.42% -2.08% -1.54% -0.49% 0.92% 1.98% -1.57% -1.01% 0.70% 1.02% -2.70% -0.62% 1.52% -0.37% -0.48% 1.44% 1.32% 0.16% 0.44% 6.48% 1.24% 2.31% -0.68% 0.03% -0.62% 1.95% -0.21% -0.16% 1.21% 0.71% -0.14% 0.52% -0.08% 0.41% 0.32% 0.55% 1.16% -2.14% 0.49% 1.54% 0.02% 2.03% 6.94% 0.04% 0.06% 0.85% 0.90% 1.51% -1.50% -0.24% -0.41% -0.25% -1.76% -0.06% 0.54% -2.40% -1.29% 1.64% -0.45% -0.46% 2.11% -0.06% -0.20% 0.30% 3.70% 1.17% -0.42% 1.27% 0.30% -0.13% -0.56% 0.59% -0.06% -2.25% -0.03% 1.76% -0.36% -0.18% 0.66% -1.14% -2.98% 0.22% 1.69% 1.10% 0.28% 2.60% 1.76% 1.09% 2.03% -0.25% 1.05% 0.00% 1.25% 2.52% -0.18% 0.07% 4.06% 3.50% -0.51% -0.66% 3.24% 2.22% 3.87% 0.47% 2.05% 0.92% 3.05% 0.50% 1.11% 2.03% 2.20% -1.30% 0.28% 1.05% -3.12% 0.20% -1.02% 0.27% -1.87% -0.73% -1.93% 1.44% -1.45% -1.78% -1.58% -0.36% 0.48% -1.78% -1.27% -1.01% 0.96% 1.21% -2.04% 0.19% 0.28% 0.13% -0.24% -0.45% 4.59% -0.10% 2.56% 0.27% 1.66% -0.32% 1.09% 2.12% 2.68% -1.10% 6.76% -2.75% -0.38% 1.11% -2.62% -1.00% 0.38% -0.76% -3.78% 0.53% -2.36% -0.81% -4.38% -0.78% -0.13% -5.22% -2.95% -2.05% 0.42% 2.48% 0.29% -0.96% 0.82% 0.88% -4.26% -0.81% -1.42% 1.16% 0.25% -1.92% 0.46% 0.96% 0.63% -2.76% -0.50% 1.78% 5.35% 1.92% 4.38% 2.86% 0.99% 0.43% 8.38% 1.84% -1.29% -2.53% 0.08% -1.84% -2.30% -0.11% -0.31% -4.90% -1.52% 0.50% 0.28% 0.03% -0.02% 0.22% -0.83% 0.34% -1.51% -0.26% 24% 2/24/2024 2/23/2024 4) Based on your beta calculations and the forecast alpha for each stock (your analysts' estimates of alpha going forward), calculate the alpha and beta of your long/short portfolio using the net weights provided in Table 2, the expected portfolio annualized excess return (above the risk free rate) and the portfolio beta return if the benchmark were to return 10% or -10% above the risk free rate over the next year. Finally, calculate the ROIC for your 1MM USD investment assuming both a -10% and 10% return of the benchmark. (4pts) 2/22/2024 2/18/2024 2/17/2024 2/16/2024 2/15/2024 MSFT CAT UNH UPS VZ MRK Forecast Alpha 10% 5% 15% -10% 5% -4% F 5% INTC -10% 2/14/2024 2/11/2024 - 43% 0.92% 1.28% 4.36% 2.12% 2.21% 5.11% -1.06% -0.81% 4.64% 1.33% -1.54% -3.07% 1.18% 1.50% -2.59% -2.37% -0.62% -0.09% -2.15% -0.91% -0.14% -1.97% -1.77% -0.07% -0.39% -1.13% -0.78% -0.19% 0.13% -0.55% -4.16% -1.07% -0.96% -1.43% -0.54% -5.32% 0.08% 0.47% 0.01% 2.85% -0.65% -2.93% -4.37% -2.02% -1.37% -2.14% 0.34% -1.11% -2.61% -2.14% -0.12% 0.11% 0.38% -0.43% -0.90% 0.07% -0.76% -0.39% 0.11% 1.85% 1.76% 0.81% 1.81% 1.53% 0.17% 1.75% 3.55% 1.61% -0.01% -0.67% -0.78% -0.10% 0.23% -0.09% -0.22% -0.51% -0.33% -0.90% -1.76% -2.52% -3.26% 053% 0.10% -293% -1.97% 1.33% 2.91% 3.82% 3.97%
Step by Step Solution
There are 3 Steps involved in it

Get step-by-step solutions from verified subject matter experts