

Question: 3. Using the midpoint method The following graph shows two known points (X and Y) on a demand curve for apples. 10 Y Demand PRICE

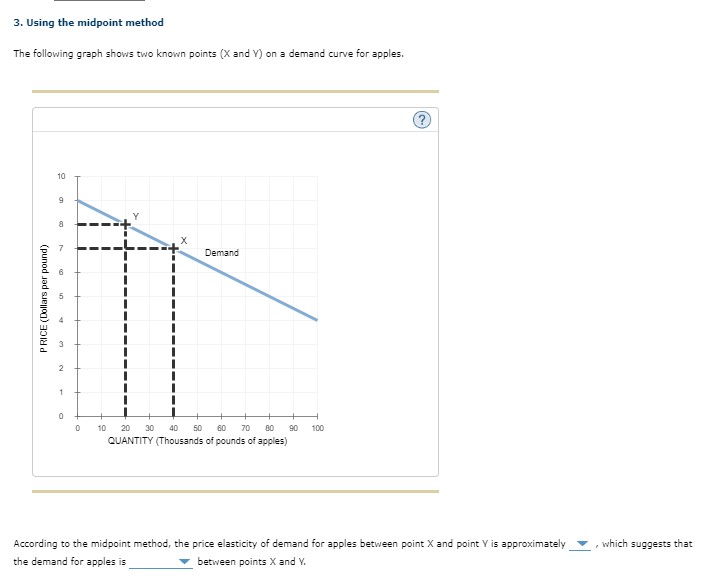
3. Using the midpoint method The following graph shows two known points (X and Y) on a demand curve for apples. 10 Y Demand PRICE (Dollars per pound) 10 20 30 40 50 70 90 100 QUANTITY (Thousands of pounds of apples) According to the midpoint method, the price elasticity of demand for apples between point X and point Y is approximately , which suggests that the demand for apples is between points X and V
Step by Step Solution
There are 3 Steps involved in it
1 Expert Approved Answer
Step: 1 Unlock

Question Has Been Solved by an Expert!
Get step-by-step solutions from verified subject matter experts
Step: 2 Unlock
Step: 3 Unlock