

Question: 3. Using the midpoint method The following graph shows two known points (X and Y) on a demand curve for tomatoes. 10 Y CO X
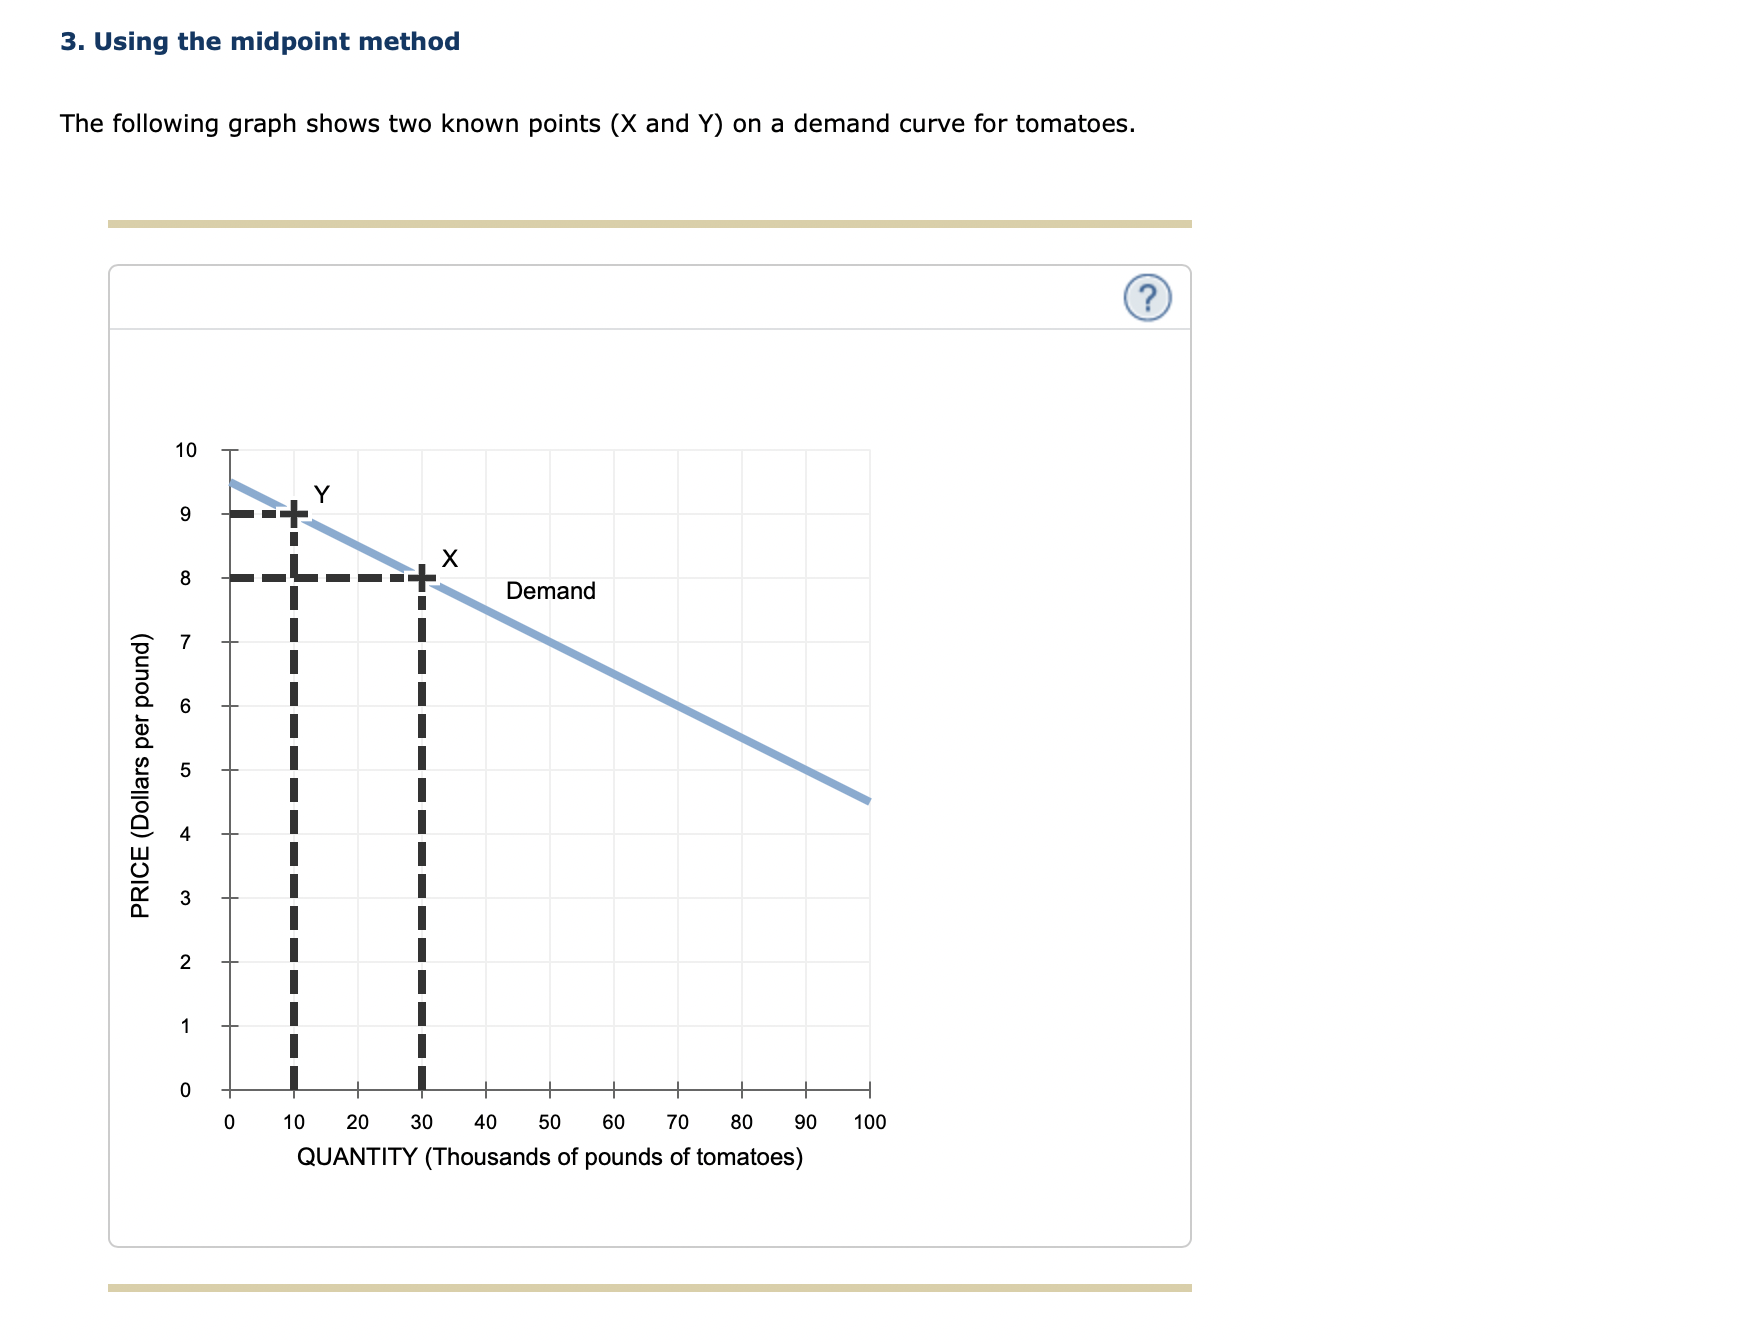


3. Using the midpoint method The following graph shows two known points (X and Y) on a demand curve for tomatoes. 10 Y CO X CO Demand 6 PRICE (Dollars per pound) N 0 10 20 30 40 50 60 70 80 90 100 QUANTITY (Thousands of pounds of tomatoes)According to the midpoint method, the price elasticity of demand for tomatoes between point X and point Y is approximately V , which suggests that the demand for tomatoes is V between points X and Y
Step by Step Solution
There are 3 Steps involved in it
1 Expert Approved Answer
Step: 1 Unlock

Question Has Been Solved by an Expert!
Get step-by-step solutions from verified subject matter experts
Step: 2 Unlock
Step: 3 Unlock