

Question: 3. Work out 2021 Cash From Operating Activities (Put zero if there is no change in the item) Statement of Cash Flows - Operating Net
| 3. Work out 2021 Cash From Operating Activities (Put zero if there is no change in the item) | |||||
| Statement of Cash Flows - Operating | |||||
| Net income | |||||
| Depreciation | |||||
| Chage in AR | |||||
| Change in Inv | |||||
| Change in AP | |||||
| Net Cash used by Operating Activities | |||||
| Hint: |
| Increase (Decrease) in any accounts from LHS of B/S (e.g. AR, inventory, etc.) is "Use (Source) of Cash", (Positive). |
| i.e., "Money out of (into) the Pocket" and the sign is Negative
|
| 4. Work out 2021 Cash From Investing Activities. | |||||
| Statement of Cash Flows - Investing | |||||
| Cash used in FA | |||||
| Change in S-T Investments | |||||
| Net cash used by Investing Activities | |||||
| 5. Work out 2021 Cash From Financing Activities. | |||||
| Statement of Cash Flows - Financing | |||||
| Change in Notes Payable | |||||
| Change in LTD | |||||
| New Equity Issuance | |||||
| Repurchase | |||||
| Payment of Cash Dividends | |||||
| Net Cash provided by Financing Activties | |||||
|
| |||||
| Hint: |
| Total Equity = Paid in Capital + R/E + Treasury Stock |
| Repurchase = New Stock Issuance + Change in Retained Earnings Change in Total Equity. |
| New stock issuance = $15000 (given) |
| Change in Retained Earning = Net Income Dividend Payment = Addition to Retained Earnings (see 2021 I/S) |
| Change in Total Equity = Equity in 2021 Equity in 2020. |
| Repurchase is cash outflow, so it is negative. |
| Payment of dividend is also cash outfolow, so it is negative. |
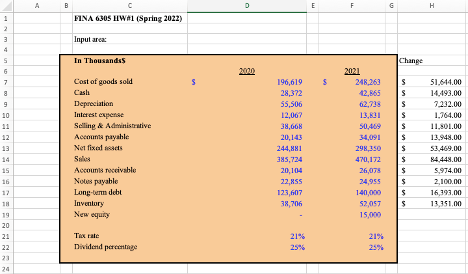
A B D E F m H C FINA 630S HIWA1 (Spring 2022) 1 2 3 4 Inpularea un In Thousands Change 200 6 7 50 s S $ 9 10 12 Cost of goods sold Casli Depreciation Interest expense Selling Administrative Accounts payable Net fixed ads Sales Accounts weivable Nous payable Long-term debt Inventory New equity 2021 248,263 12,865 62,738 13,831 50,469 34,091 298,350 470,172 26,078 24,955 140,000 52,057 15,000 196,619 28,372 55,506 12,067 38,668 20,143 244,881 395,724 20,104 22,855 123,607 38,706 13 51,614.00 14.493.00 7.232.00 1.764.00 11.801.00 13.948.00 53.469.00 84.448.00 5,974.00 2,100.00 16,193,00 13,351,00 $ $ $ $ $ $ $ $ 15 16 11 19 20 21 21% Tax rate Dividend percentage 21% 25% 23 24 A B D E F m H C FINA 630S HIWA1 (Spring 2022) 1 2 3 4 Inpularea un In Thousands Change 200 6 7 50 s S $ 9 10 12 Cost of goods sold Casli Depreciation Interest expense Selling Administrative Accounts payable Net fixed ads Sales Accounts weivable Nous payable Long-term debt Inventory New equity 2021 248,263 12,865 62,738 13,831 50,469 34,091 298,350 470,172 26,078 24,955 140,000 52,057 15,000 196,619 28,372 55,506 12,067 38,668 20,143 244,881 395,724 20,104 22,855 123,607 38,706 13 51,614.00 14.493.00 7.232.00 1.764.00 11.801.00 13.948.00 53.469.00 84.448.00 5,974.00 2,100.00 16,193,00 13,351,00 $ $ $ $ $ $ $ $ 15 16 11 19 20 21 21% Tax rate Dividend percentage 21% 25% 23 24
Step by Step Solution
There are 3 Steps involved in it

Get step-by-step solutions from verified subject matter experts