

Question: Please complete, 2019 Cash From Financing Activites. Question 5 in Thousands $ Cost of goods sold Cash Depreciation Interest expense Selling & Administrative Accounts payable
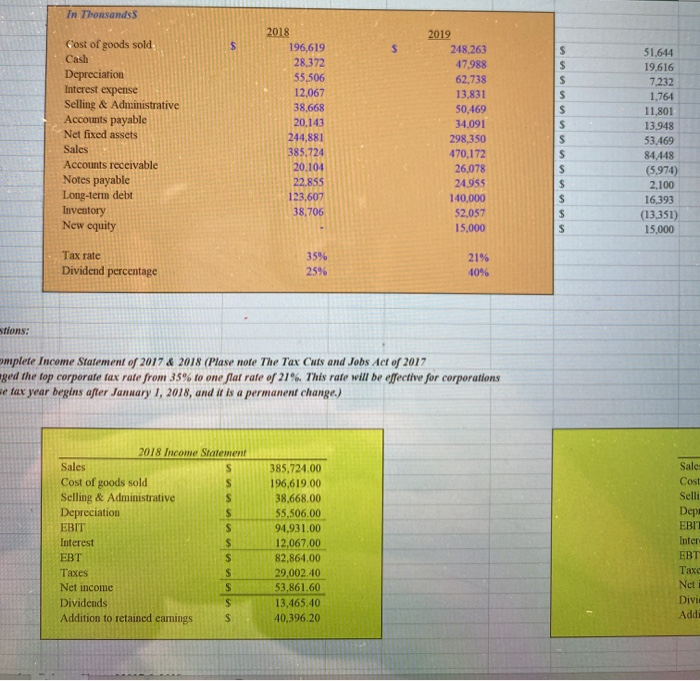
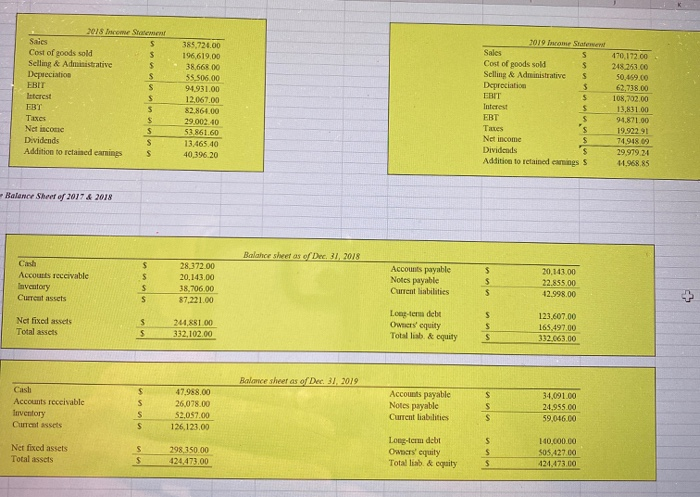
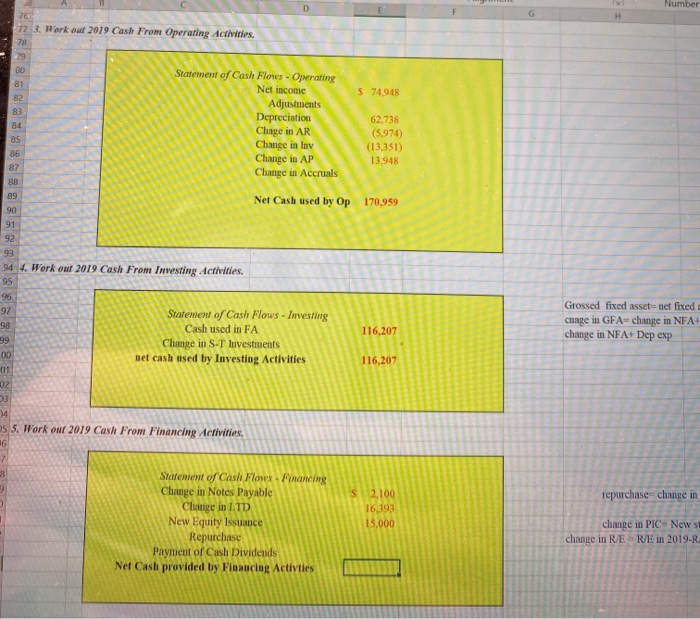
in Thousands $ Cost of goods sold Cash Depreciation Interest expense Selling & Administrative Accounts payable Net fixed assets Sales Accounts receivable Notes payable Long-term debt Inventory New equity 2018 196,619 28,372 55,506 12,067 38,668 20,143 244,881 385.724 20.104 22.855 123,607 38,706 2019 248,263 47.988 62.738 13,831 50,469 34,091 298,350 470,172 26,078 24.955 140,000 52,057 15,000 $ $ S S S s s s $ 51.644 19,616 7.232 1.764 11,801 13.948 53.469 84.448 (5,974) 2,100 16,393 (13,351) 15.000 S s $ s Tax rate Dividend percentage 35% 25% 2196 40% stions: omplete Income Statement of 2017 & 2018 (Plase note The Tax Cuts and Jobs Act of 2017 ged the top corporate tax rate from 35% to one flat rate of 21%. This rate will be effective for corporations me tax year begins after January 1, 2018, and it is a permanent change.) Sale Cost Selli Depe 2018 Income Statement Sales Cost of goods sold S Selling & Administrative S Depreciation $ EBIT $ Interest $ EBT $ Taxes S Net income S Dividends $ Addition to retained earnings $ 385,724.00 196,619.00 38,668.00 55.506,00 94,931.00 12,067.00 82,864.00 29.002.40 53,861.60 13,465.40 40,396.20 EBIT Inter EBT Taxe Net Divi Addi s 2018 me Statement Saics s Cost of Boods sold $ Selling & Administrative S Depreciation EBIT S Interest 5 EBT $ Taxes $ Net income s Dividends s Addition to related earnings s 385,724.00 196.619.00 38.668.00 35.506.00 94931.00 12.067.00 82.864.00 29.00240 53861.60 13.465.40 40.396.20 2019 Income Statement Sales S Cost of goods sold $ Selling & Administrative s Depreciation $ FRIT $ Interest $ EBT $ Taxes 's Net income S Divideuds $ Addition to retained earnings S 470,172.00 248 253.50 50.499.00 62.738.00 108,702,00 13,831.00 94.871.00 19.92291 74,918 09 29.979.24 41.968.85 Balance Sheet of 2017 & 2018 Balance sheet as of Dec. 31, 2018 Cash Accounts receivable Inventory Cureat assets $ s S 28.372.00 20,143.00 38,706,00 87.221.00 Accounts payable Notes payable Current liabilities $ $ $ 20.143.00 22.855.00 42.998.00 S Long-term debt Net fixed assets Total assets $ 5 244,881.00 332.102.00 Owners' equity Total lib. & equity S $ $ 123.607.00 165,497.00 332.063.00 Balance sheet as of Dec 31, 2019 Cash Accounts receivable Inventory Current assets s s S S 47.988.00 26.078.00 52.057.00 126, 123.00 Accounts payable Notes payable Current liabilities S S 34,091.00 24.955.00 59,046.00 S Net fixed assets Total assets s $ 298,350.00 424.473.00 Long-term debt Owners' equity Total lib. & equity S $ $ 140.000.00 505427.00 424.473.00 Number G H 80 82 76 77 3. Work out 2019 Cash From Operating Activities. 78 29 Statement of Cash Flows - Operating 81 Net income $74.948 Adjustments 83 Depreciation 62,738 84 Chage in AR (5,974) 85 Change in lov (13,351) 86 Change in AP 13.948 87 Change in Accruals 89 Net Cash used by Op 170,959 90 91 92 93 94 4. Work out 2019 Cash From Investing Activities. 95 96 97 Statement of Cash Flows - Investing Cash used in FA 116,207 Change in S-T lovestments 00 net cash used by Investing Activities 116,207 01 02 03 M4 55. Work onr 2019 Cash From Financing Activities, 16 7 Statement of Cash Flows Financing 9 Change in Notes Payable S 2.100 Change in ITD 16,393 New Equity Issuance 15,000 Repurchase Paynient of Cush Dividends Net Cash provided by Financing Activies 98 Grossed fixed asset-net fixed chage in GFA-change in NFA+ change in NFA+ Dep exp 99 repurchase change in change in PIC=News change in RE RE in 2019-R O
Step by Step Solution
There are 3 Steps involved in it

Get step-by-step solutions from verified subject matter experts