

Question: 30) Below is a payoff table that lists tour mortgage options. The numbers in the table represent borrowing costs. All the decision analysis questions that
30)
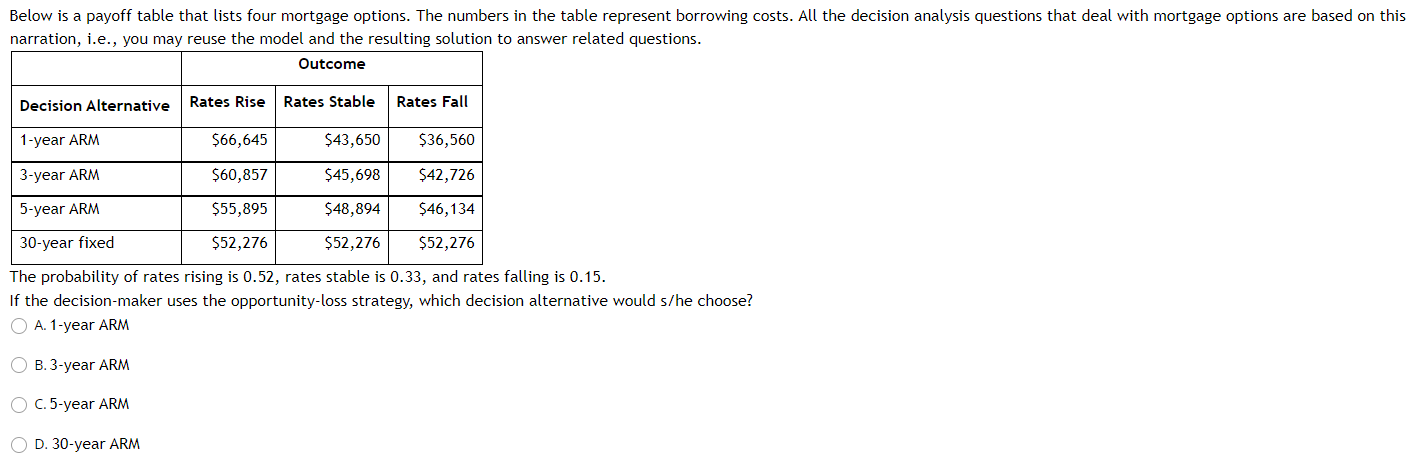
Below is a payoff table that lists tour mortgage options. The numbers in the table represent borrowing costs. All the decision analysis questions that deal with mortgage options are based on this narration, i.e., you may reuse the model and the resulting solution to answer related questions. Outcome Decision AkemaVE Rates Rise Rates Stable Rates Fall 1'YeairARJ'ld'i $66,645 $43,650 $36,560 m m 30-year fixed $52,276 $52,275 552,2?6 The probability of rates rising is 0.52, rates stable is 0.33, and rates falling is 0.15. f the decisionrmaker uses the opportunityrloss strategy, which decision alternative would sfhe choose? A.1-yearARM 53-year ARM C. BeyearARM D. 307year ARM
Step by Step Solution
There are 3 Steps involved in it

Get step-by-step solutions from verified subject matter experts