Question: Below is a payoff table that lists four mortgage options. The numbers in the table represent borrowing costs. All the decision analysis questions that deal
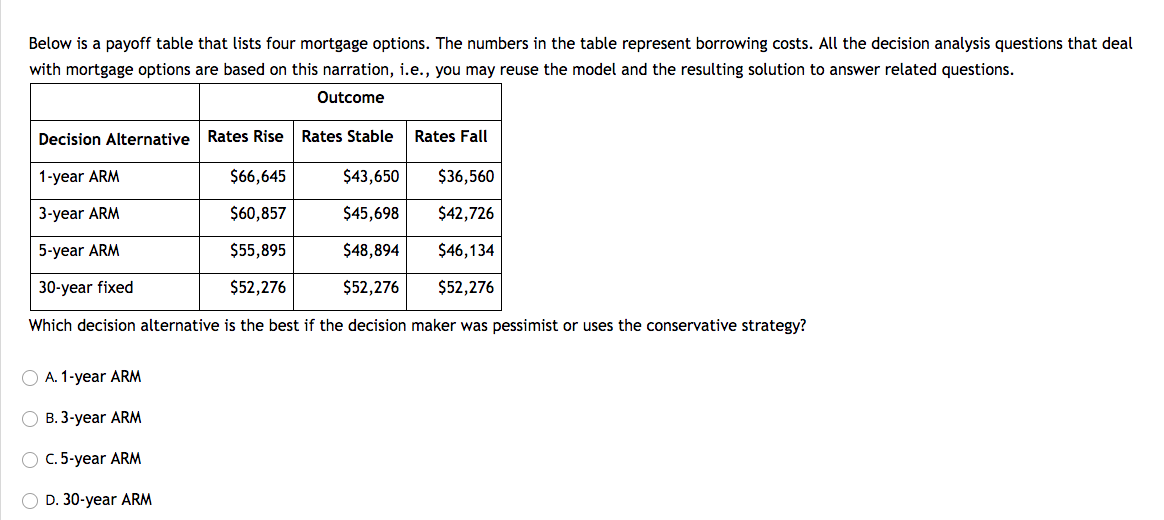
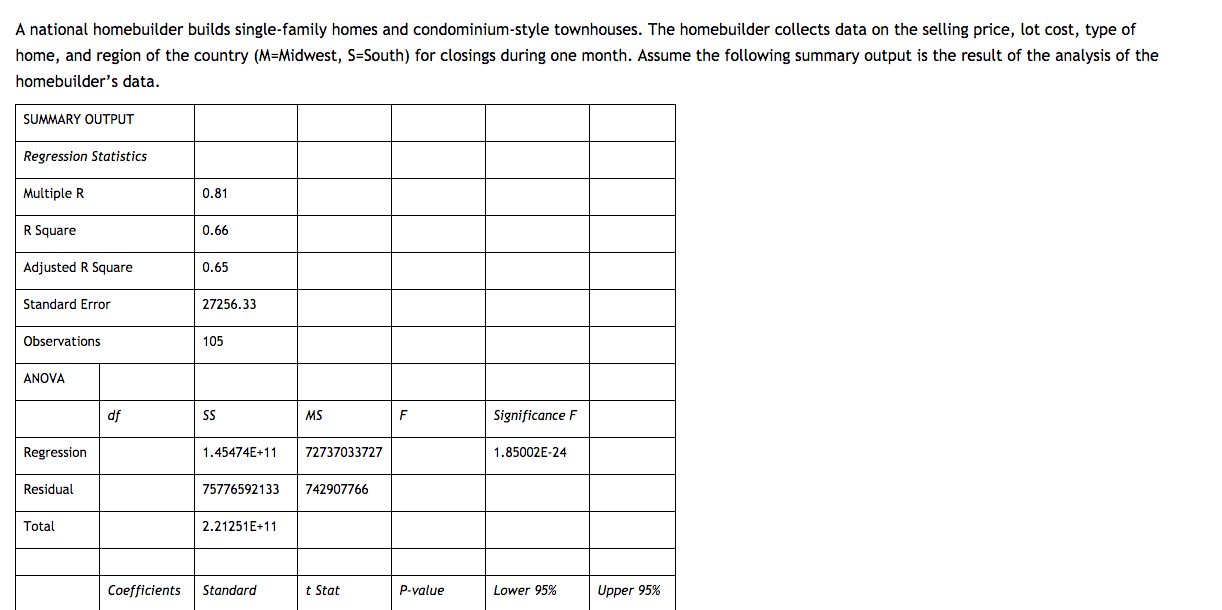
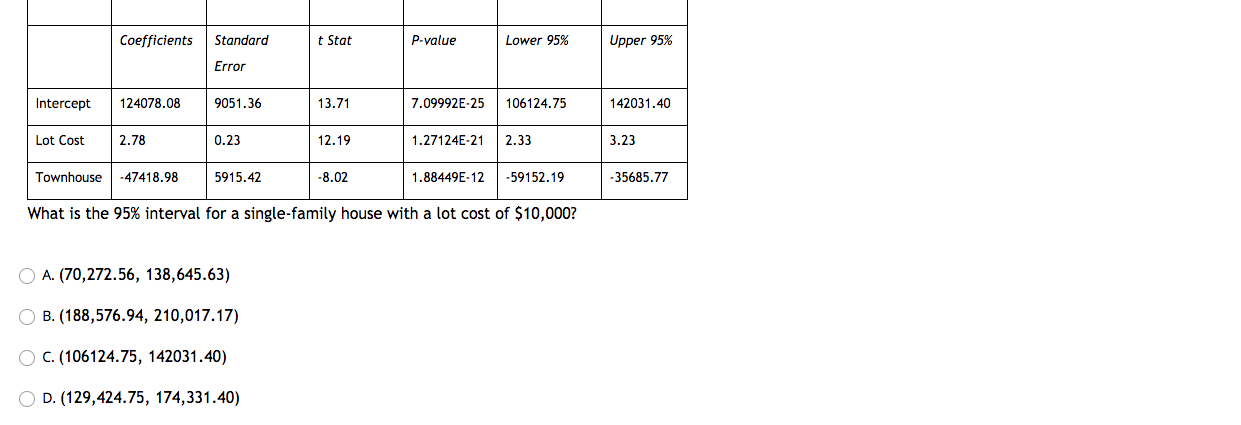
Below is a payoff table that lists four mortgage options. The numbers in the table represent borrowing costs. All the decision analysis questions that deal with mortgage options are based on this narration, i.e., you may reuse the model and the resulting solution to answer related questions. Outcome Decision Alternative Rates Rise Rates Stable Rates Fall 1-year ARM $66,645 $43,650 $36,560 3-year ARM $60,857 $45,698 $42,726 5-year ARM $55,895 $48,894 $46,134 30-year fixed $52,276 $52,276 $52,276 Which decision alternative is the best if the decision maker was pessimist or uses the conservative strategy? O A. 1-year ARM OB. 3-year ARM O C. 5-year ARM D. 30-year ARM A national homebuilder builds single-family homes and condominium-style townhouses. The homebuilder collects data on the selling price, lot cost, type of home, and region of the country (M=Midwest, S=South) for closings during one month. Assume the following summary output is the result of the analysis of the homebuilder's data. SUMMARY OUTPUT Regression Statistics Multiple R 0.81 R Square 0.66 Adjusted R Square 0.65 Standard Error 27256.33 Observations 105 ANOVA df SS MS F Significance F Regression 1.45474E+11 72737033727 1.85002E-24 Residual 75776592133 742907766 Total 2.21251E+11 Coefficients Standard t Stat P-value Lower 95% Upper 95% Coefficients Standard t Stat P-value Lower 95% Upper 95% Error Intercept 124078.08 9051.36 13.71 7.09992E-25 106124.75 142031.40 Lot Cost 2.78 0.23 12.19 1.27124E-21 2.33 3.23 Townhouse -47418.98 5915.42 -8.02 1.88449E-12 -59152.19 -35685.77 What is the 95% interval for a single-family house with a lot cost of $10,000? O A. (70,272.56, 138,645.63) O B. (188,576.94, 210,017.17) OC. (106124.75, 142031.40) D. (129,424.75, 174,331.40) Below is a payoff table that lists four mortgage options. The numbers in the table represent borrowing costs. All the decision analysis questions that deal with mortgage options are based on this narration, i.e., you may reuse the model and the resulting solution to answer related questions. Outcome Decision Alternative Rates Rise Rates Stable Rates Fall 1-year ARM $66,645 $43,650 $36,560 3-year ARM $60,857 $45,698 $42,726 5-year ARM $55,895 $48,894 $46,134 30-year fixed $52,276 $52,276 $52,276 Which decision alternative is the best if the decision maker was pessimist or uses the conservative strategy? O A. 1-year ARM OB. 3-year ARM O C. 5-year ARM D. 30-year ARM A national homebuilder builds single-family homes and condominium-style townhouses. The homebuilder collects data on the selling price, lot cost, type of home, and region of the country (M=Midwest, S=South) for closings during one month. Assume the following summary output is the result of the analysis of the homebuilder's data. SUMMARY OUTPUT Regression Statistics Multiple R 0.81 R Square 0.66 Adjusted R Square 0.65 Standard Error 27256.33 Observations 105 ANOVA df SS MS F Significance F Regression 1.45474E+11 72737033727 1.85002E-24 Residual 75776592133 742907766 Total 2.21251E+11 Coefficients Standard t Stat P-value Lower 95% Upper 95% Coefficients Standard t Stat P-value Lower 95% Upper 95% Error Intercept 124078.08 9051.36 13.71 7.09992E-25 106124.75 142031.40 Lot Cost 2.78 0.23 12.19 1.27124E-21 2.33 3.23 Townhouse -47418.98 5915.42 -8.02 1.88449E-12 -59152.19 -35685.77 What is the 95% interval for a single-family house with a lot cost of $10,000? O A. (70,272.56, 138,645.63) O B. (188,576.94, 210,017.17) OC. (106124.75, 142031.40) D. (129,424.75, 174,331.40)


