

Question: 30.Which statement best describes the relationship in terms ofdirectionandstrengthbetween the two variables presented in the scatterplot below. fModel Summary Adjusted R Std. Error of Model

30.Which statement best describes the relationship in terms ofdirectionandstrengthbetween the two variables presented in the scatterplot below.
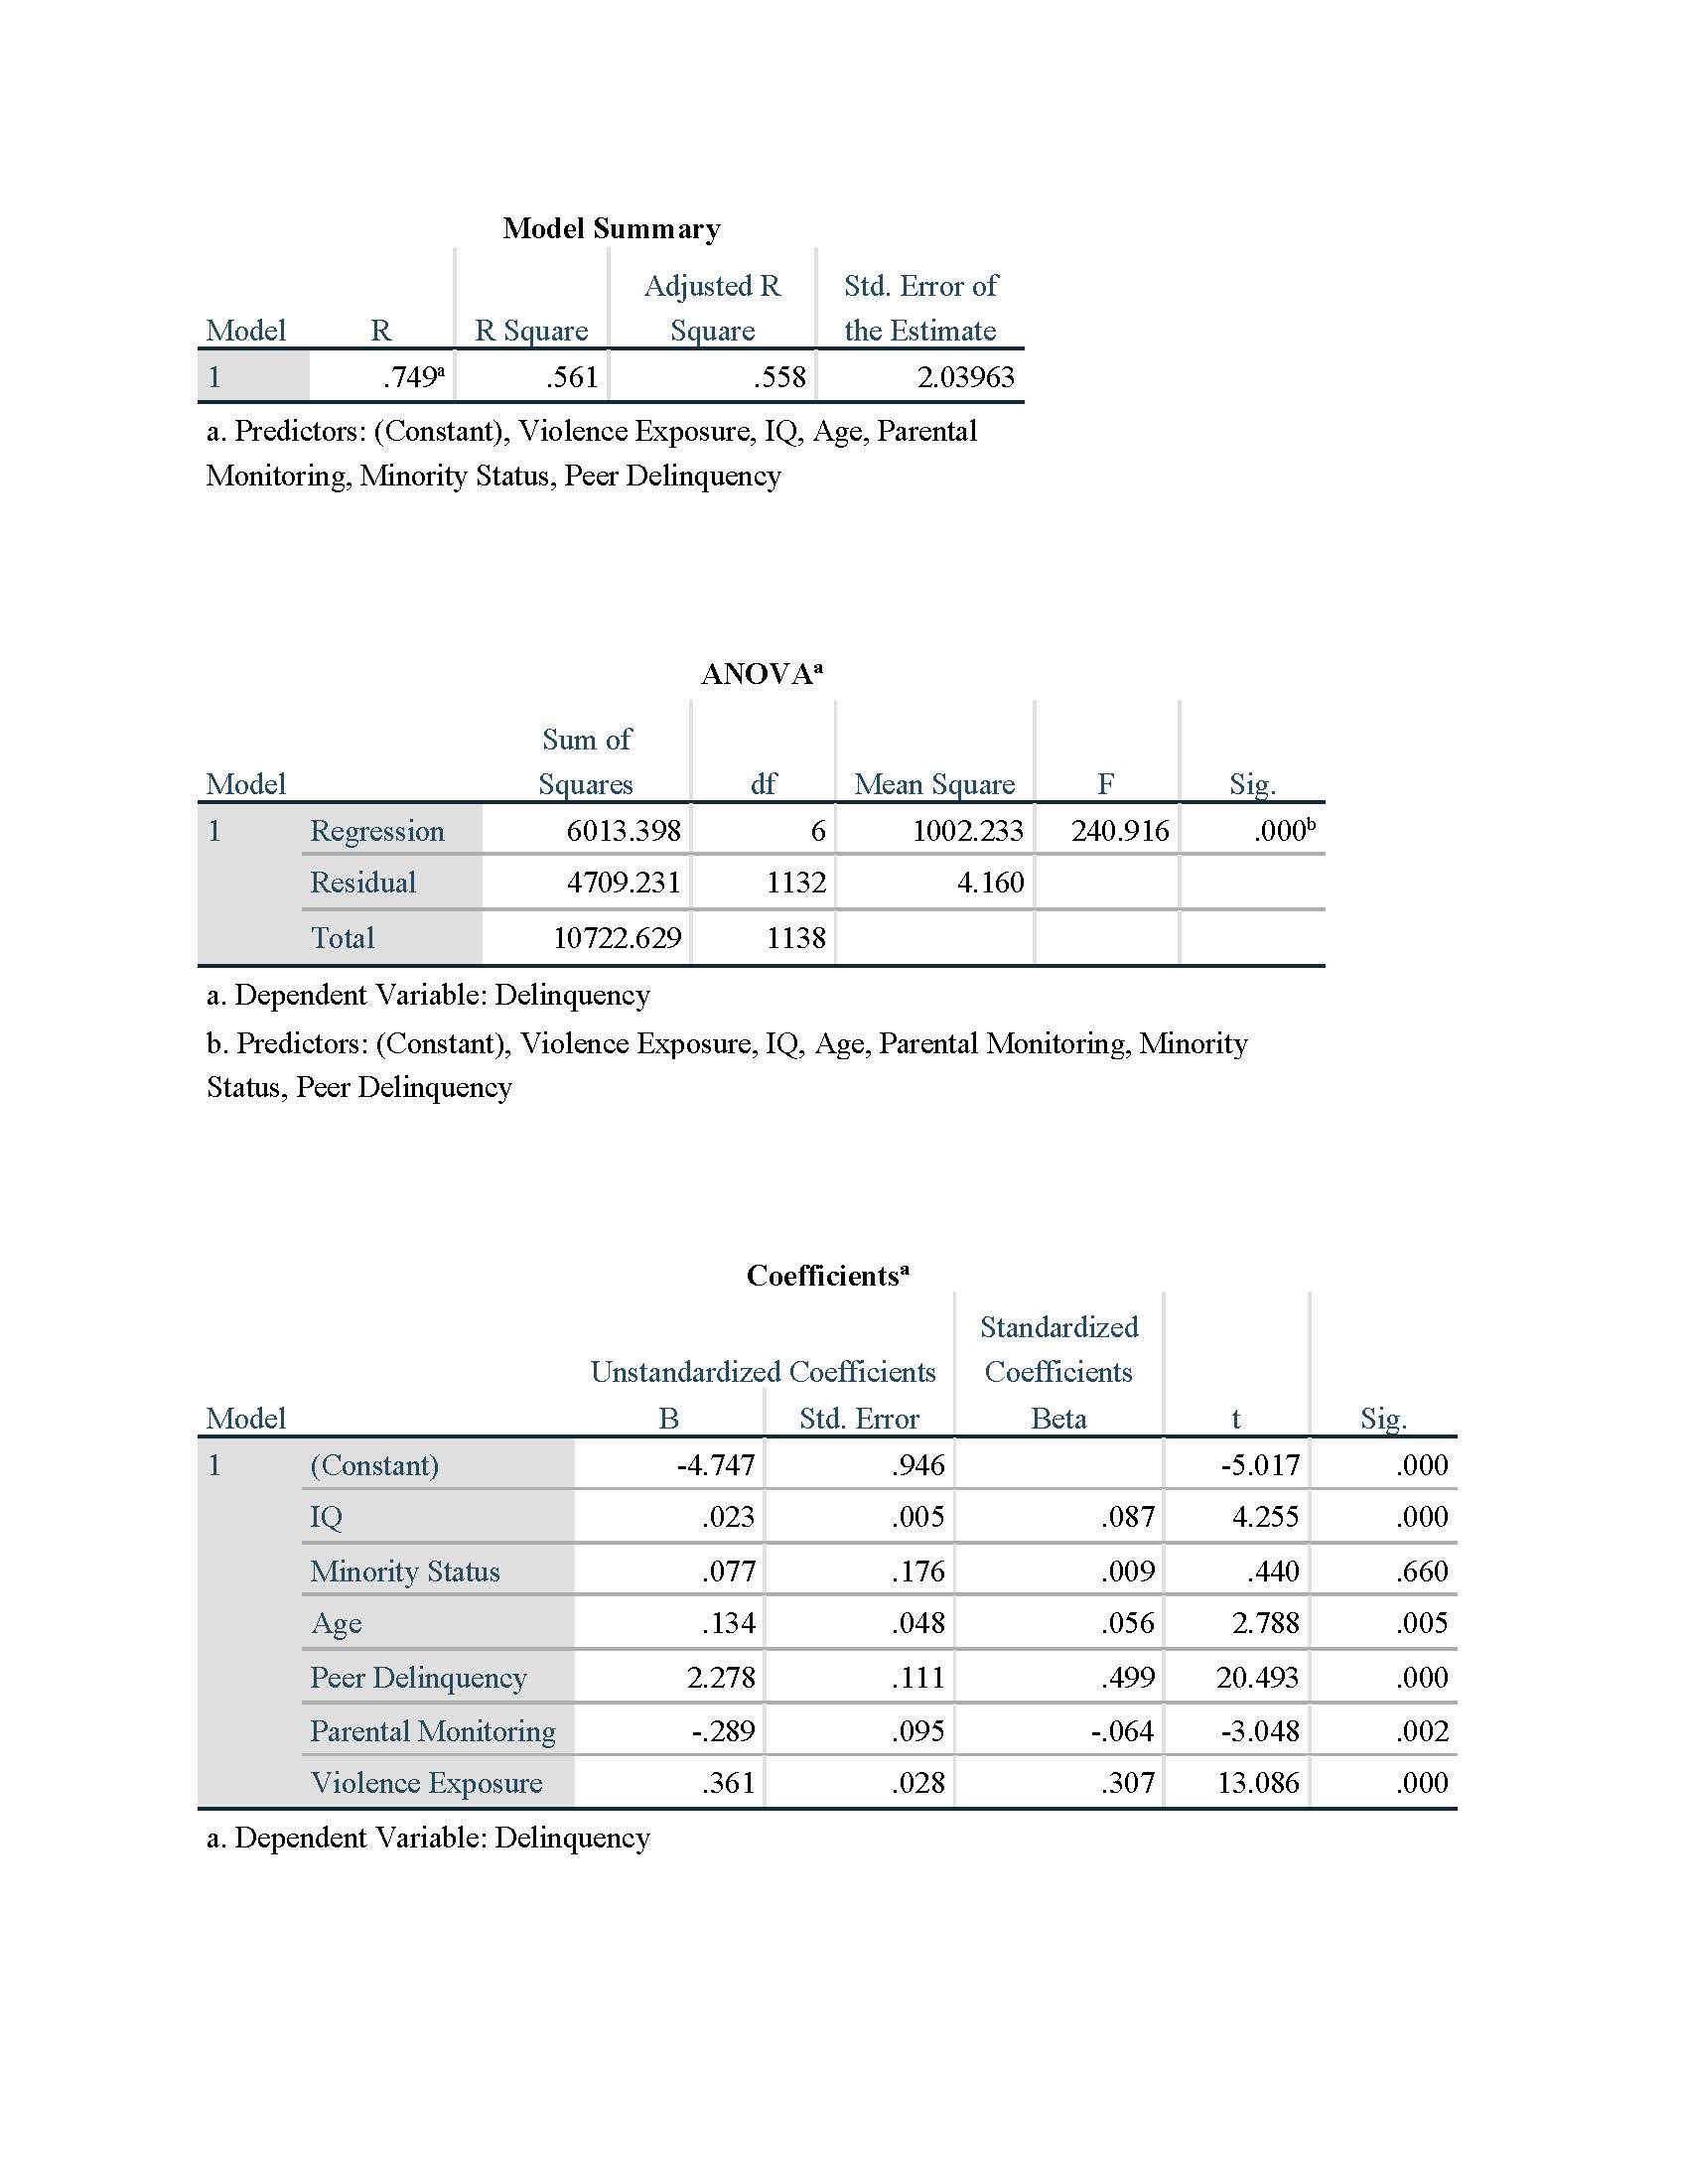
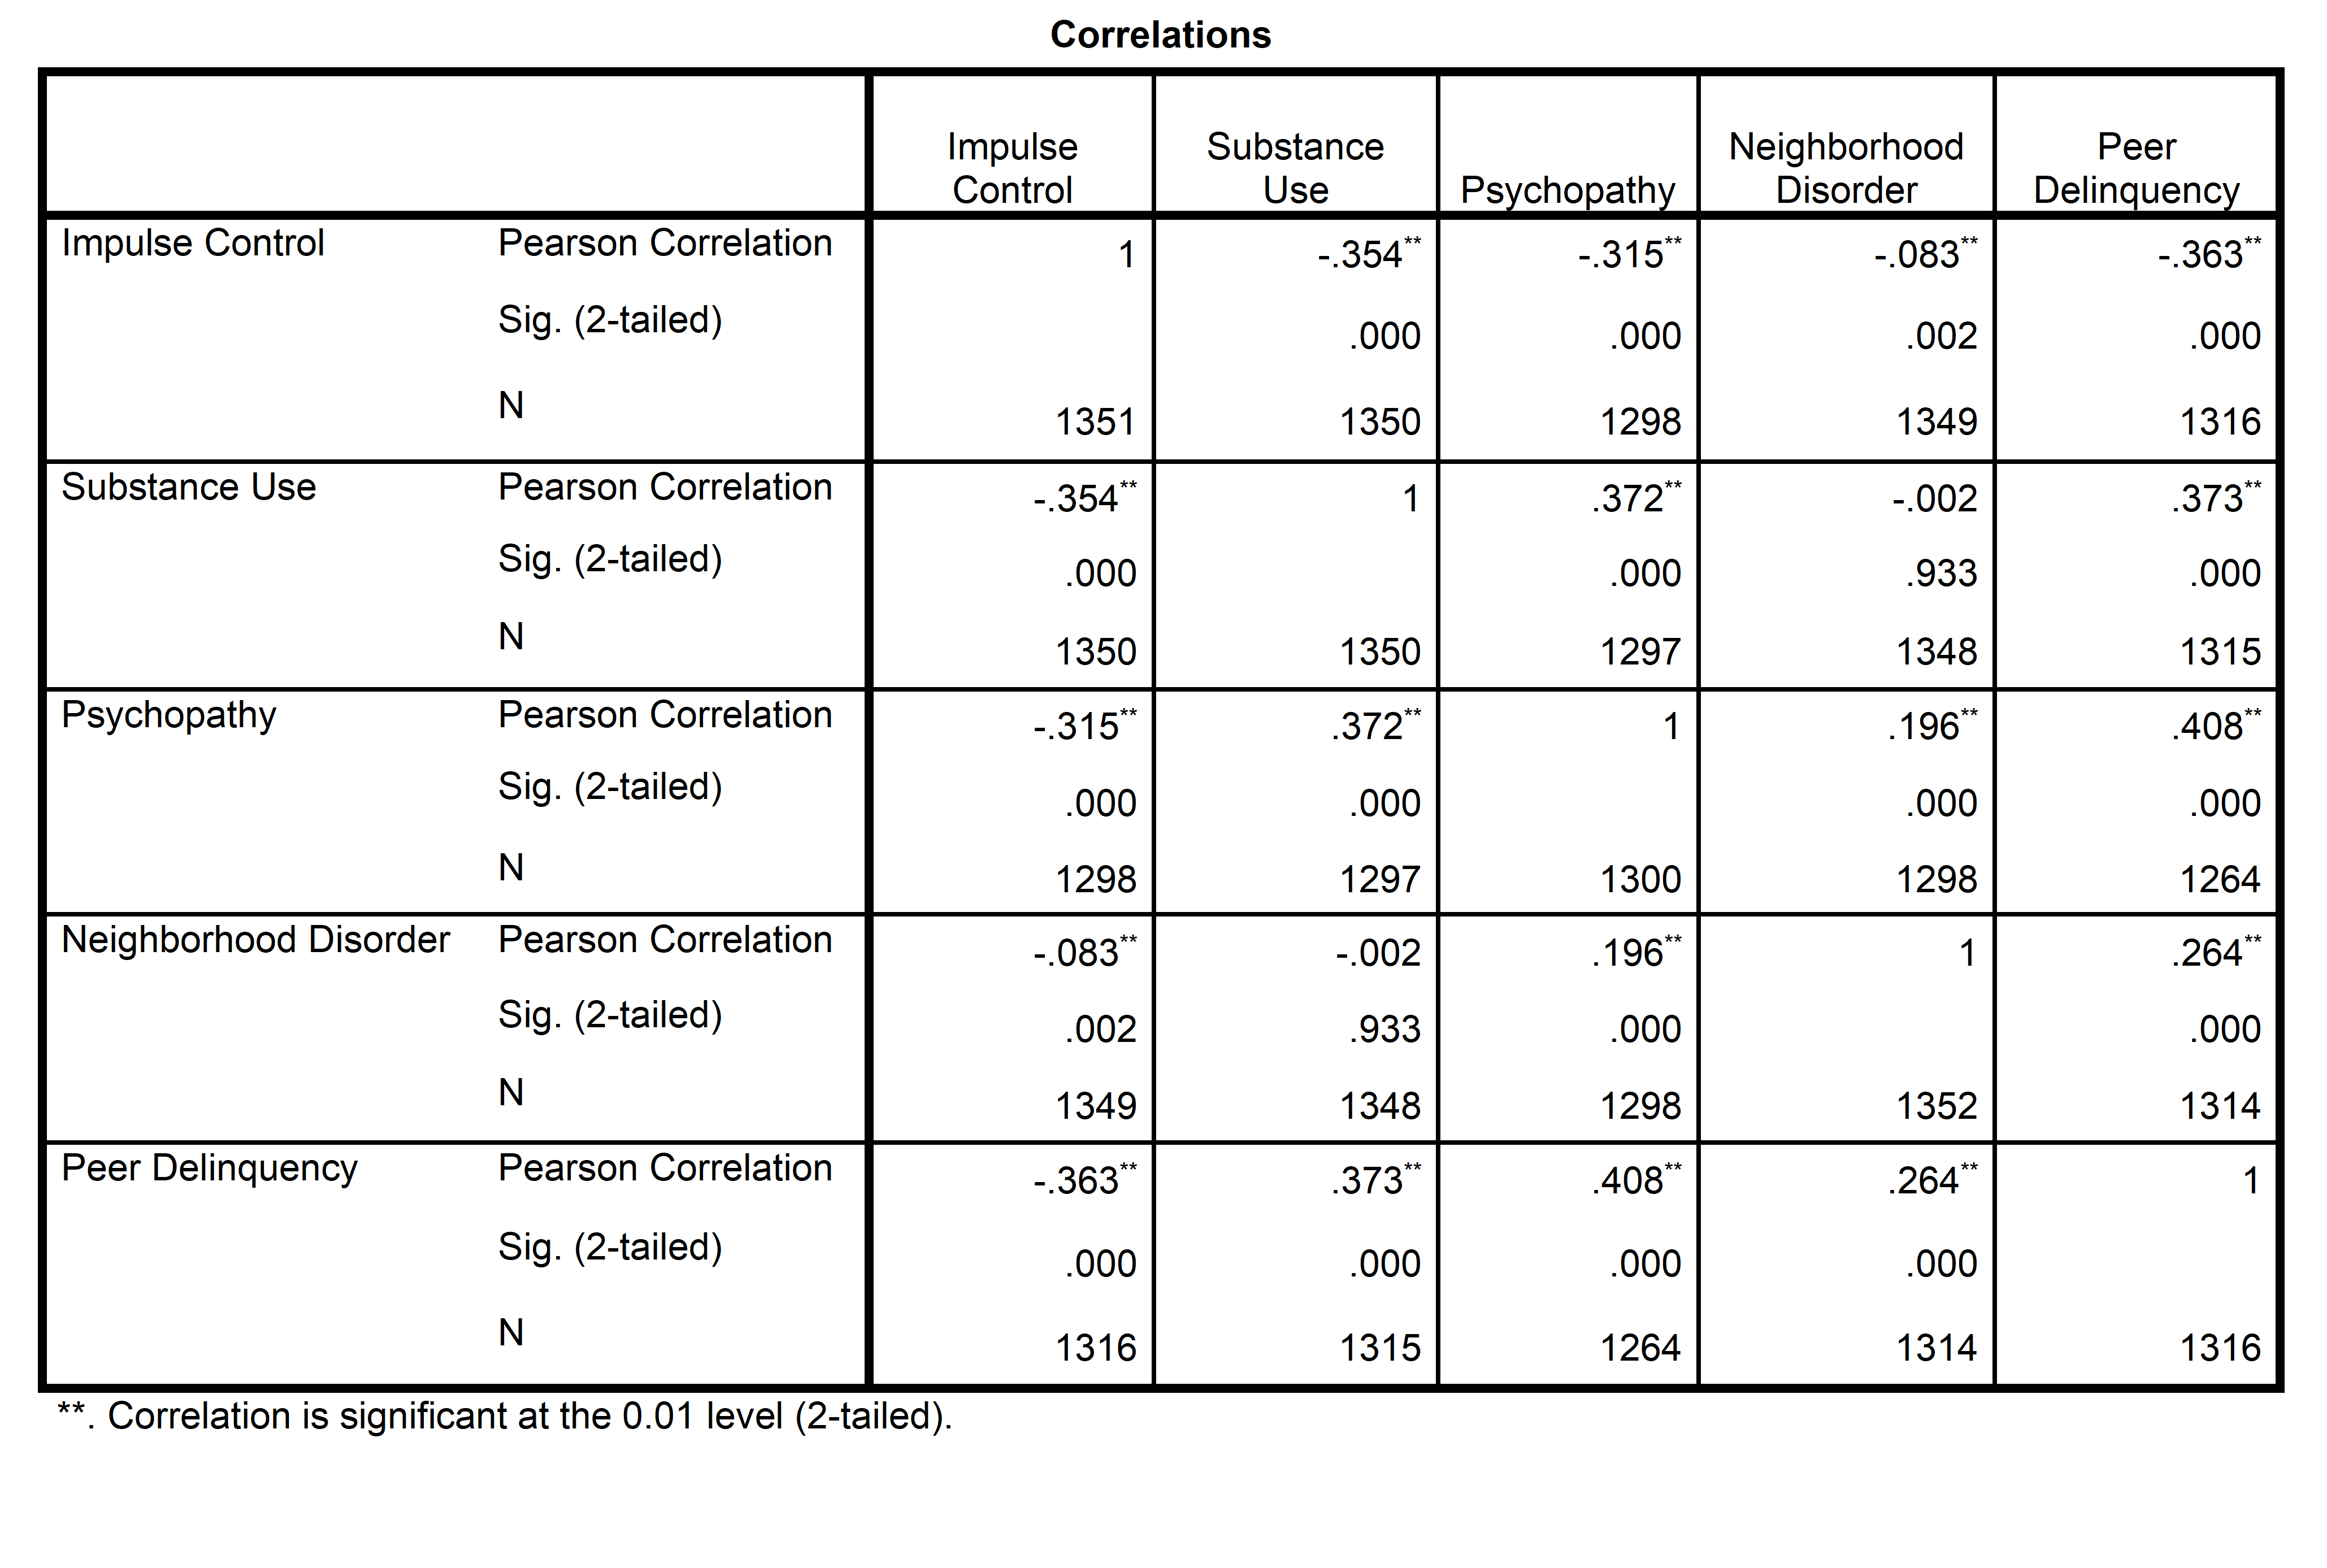
\fModel Summary Adjusted R Std. Error of Model R R Square Square the Estimate 749 561 558 2.03963 a. Predictors: (Constant), Violence Exposure, IQ, Age, Parental Monitoring, Minority Status, Peer Delinquency ANOVA Sum of Model Squares df Mean Square Sig Regression 6013.398 6 1002.233 240.916 000b Residual 4709.231 1132 4. 160 Total 10722.629 1138 a. Dependent Variable: Delinquency b. Predictors: (Constant), Violence Exposure, IQ, Age, Parental Monitoring, Minority Status, Peer Delinquency Coefficients Standardized Unstandardized Coefficients Coefficients Model B Std. Error Beta Sig (Constant) 4.747 946 -5.017 000 IC 23 005 087 4.255 .000 Minority Status 077 176 .009 440 660 Age 134 048 056 2.788 Peer Delinquency 2.278 111 499 20.493 100 Parental Monitoring -.289 095 -.064 -3.048 .002 Violence Exposure .361 028 307 13.086 .000 a. Dependent Variable: DelinquencyCorrelations Impulse Substance Neighborhood Peer Control Use Psychopathy Disorder Impulse Control Delinquency Pearson Correlation -.354** -.315** -.083** -.363* Sig. (2-tailed) 000 000 002 .000 N 1351 1350 1298 1349 1316 Substance Use Pearson Correlation -.354** 372** -.002 373** Sig. (2-tailed) .000 000 933 000 N 1350 1350 1297 1348 1315 Psychopathy Pearson Correlation -.315* 372* 1 196** .408* Sig. (2-tailed) 000 000 000 000 N 1298 1297 1300 1298 1264 Neighborhood Disorder Pearson Correlation -.083** -.002 . 196** 264* Sig. (2-tailed) 002 .933 000 000 N 1349 1348 1298 1352 1314 Peer Delinquency Pearson Correlation -.363** 373* 408** 264** Sig. (2-tailed) 000 000 000 000 N 1316 1315 1264 1314 1316 **. Correlation is significant at the 0.01 level (2-tailed)
Step by Step Solution
There are 3 Steps involved in it

Get step-by-step solutions from verified subject matter experts