

Question: 3.1. Under the section write a script that plot two sine waves on the same plot. Create a time vector t from 0 to
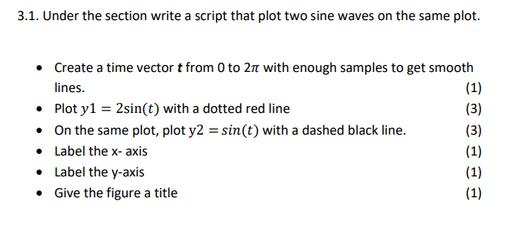
3.1. Under the section write a script that plot two sine waves on the same plot. Create a time vector t from 0 to 27 with enough samples to get smooth lines. Plot y1 = 2sin(t) with a dotted red line On the same plot, plot y2 = sin(t) with a dashed black line. Label the x-axis Label the y-axis Give the figure a title (1) (3) (3) (1) (1) (1)
Step by Step Solution
There are 3 Steps involved in it
1 Expert Approved Answer
Step: 1 Unlock

Question Has Been Solved by an Expert!
Get step-by-step solutions from verified subject matter experts
Step: 2 Unlock
Step: 3 Unlock