

Question: 312 PART 2 DESIGNING OPERATIONS CASE STUDIES Cecil Rice Export, Alexandria, Egypt Cecil Rice Export operates a facility in Alexandria, Egypt, where bulk white rice
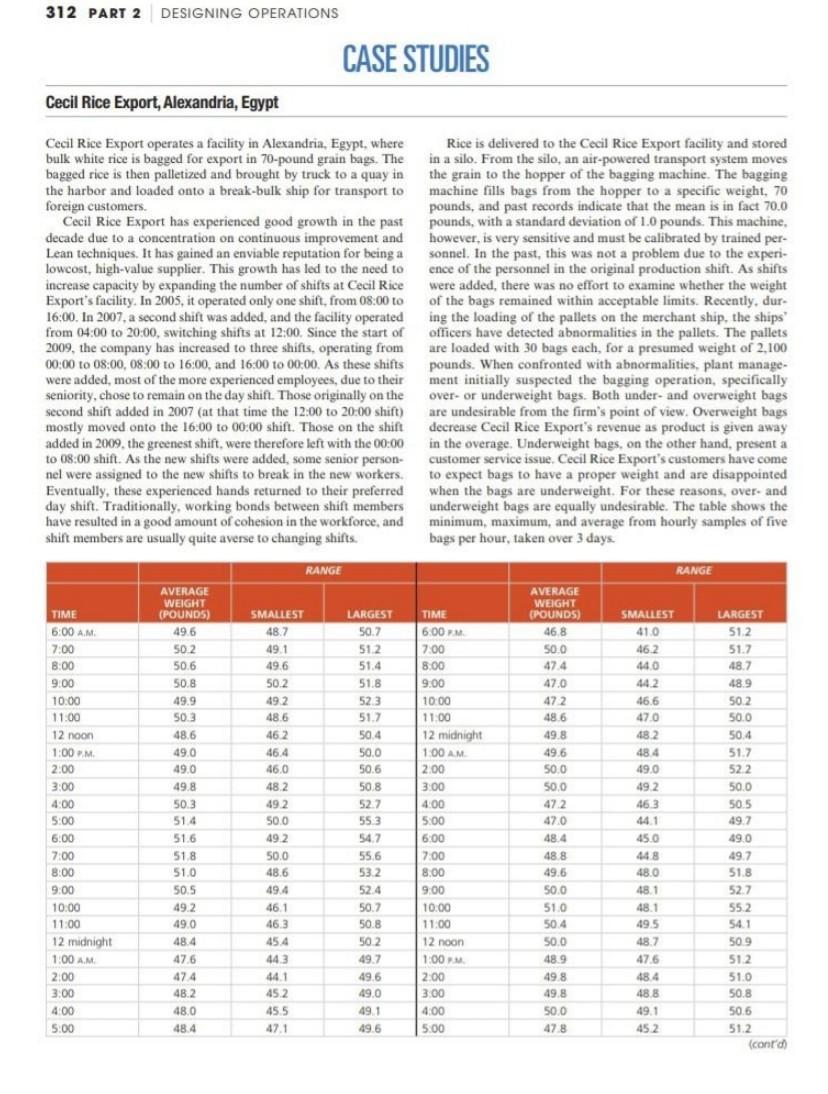
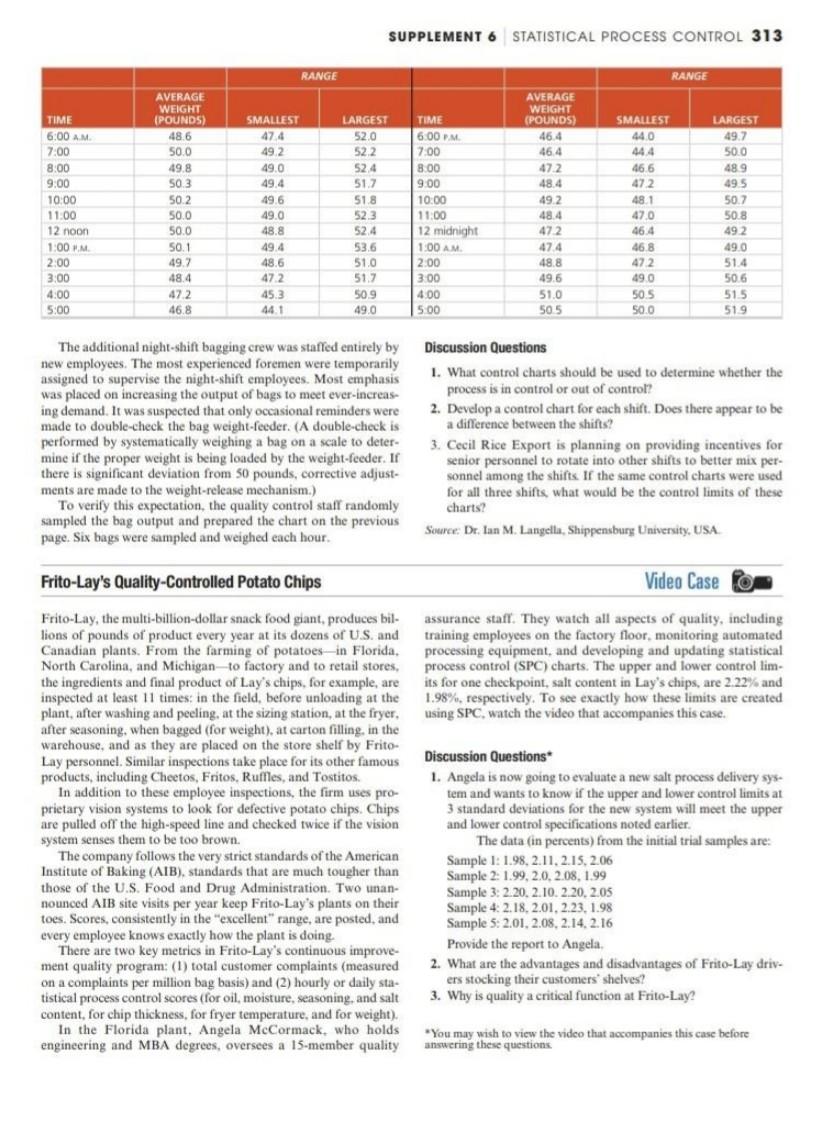
312 PART 2 DESIGNING OPERATIONS CASE STUDIES Cecil Rice Export, Alexandria, Egypt Cecil Rice Export operates a facility in Alexandria, Egypt, where bulk white rice is bagged for export in 70-pound grain bags. The bagged rice is then palletized and brought by truck to a quay in the harbor and loaded onto a break-bulk ship for transport to foreign customers. Cecil Rice Rice Export has experienced good growth in the past decade due to a concentration on continuous improvement and Lean techniques. It has gained an enviable reputation for being a lowcost, high-value supplier. This growth has led to the need to increase by expanding the number of shifts at Cecil Rice Export's facility. In 2005, it operated only one shift, from 08:00 to 16:00. In 2007, a second shift was added, and the e facility operated from 04:00 to 20:00, switching shifts at 12:00. Since the start of 2009, the company has increased to three shifts, operating from 00:00 to 08:00, 08:00 to 16:00 and 16:00 to 00:00. As these shifts were added, most of the more experienced employees, due to their seniority, chose to remain on the day shift. Those originally on the second shift added in 2007 (at that time the 12:00 to 20:00 shift) mostly moved onto the 16:00 to 00:00 shift. Those on the shift added in 2009, the greenest shift were therefore left with the 00:00 to 08:00 shift. As the new shifts were added, some senior person nel were assigned to the new shifts to break in the new workers. Eventually, these experienced hands returned to their preferred day shift. Traditionally, working bonds between shift members have resulted in a good amount of cohesion in the workforce, and shift members are usually quite averse to changing shifts. Rice is delivered to the Cecil Rice Export facility and stored in a silo. From the silo, an air-powered transport system moves the grain to the hopper of the bagging machine. The bagging machine fills bags from the hopper to a specific weight. 70 pounds, and past records indicate that the mean is in fact 70.0 pounds, with a standard deviation of 10 pounds. This machine, however, is very sensitive and must be calibrated by trained per- sonnel. In the past, this was not a problem due to the ence of the personnel in the original production shift. As shifts were added, there was no effort to examine whether the weight of the bags remained within acceptable limits. Recently, dur- ing the loading of the pallets on the merchant ship, the ships officers have detected abnormalities in the pallets. The pallets are loaded with 30 bags each, for a presumed weight of 2,100 ment initially suspected the bagging operation weight bags pounds. When confronted with abnormalities, plant manage- endala are undesirable from the firm's point of view. Overweight bags s point of view Ourus decrease Cecil Rice Export's revenue as product is given away in the overage. Underweight bags, on the other hand, present a customer service issue. Cecil Rice Export's customers have come to expect bags to have a proper weight and are disappointed when the bags are underweight. For these reasons, over- and underweight bags are equally undesirable. The table shows the minimum, maximum, and average from hourly samples of five bags per hour, taken over 3 days. Specifically over or RANGE RANGE TIME 6.00 PM 7.00 8.00 9.00 10:00 11:00 TIME 6:00 AM 7:00 8.00 9.00 10.00 11:00 12 noon 1:00 PM 2.00 3:00 4:00 5:00 6:00 7:00 8:00 9:00 10.00 11:00 12 midnight 1:00 AM 2:00 3.00 4.00 5.00 AVERAGE WEIGHT (POUNDS) 496 502 50.6 50.8 49.9 50.3 48.6 49.0 49.0 49.8 503 514 51.6 518 51.0 50.5 49.2 49.0 484 47.6 474 48.2 48.0 48.4 SMALLEST 48.7 49.1 49.6 50.2 492 48.6 462 46.4 46.0 482 492 50.0 49.2 50.0 48.6 49.4 46.1 46.3 45.4 443 44.1 452 45.5 47.1 LARGEST 50.7 512 51.4 51.8 523 51.7 50.4 50.0 50,6 508 527 553 542 55.6 53.2 52.4 50.7 50.8 502 49.7 49.6 49.0 49.1 49.6 12 midnight 1:00 AM 2.00 3:00 4.00 5.00 6:00 7.00 8.00 9.00 10.00 11.00 12 noon 1:00 2:00 3.00 4:00 5.00 AVERAGE WEIGHT (POUNDS) 46.8 50.0 47.4 47.0 472 48.6 49.8 49.6 50.0 500 472 47.0 48.4 48.8 49.6 50.0 51.0 50.4 50.0 48.9 498 49.8 50.0 478 SMALLEST 410 46.2 440 442 46.6 470 482 48.4 49.0 492 463 44.1 45.0 448 48.0 481 48.1 49.5 487 47.6 484 48.8 49.1 452 LARGEST 512 51.7 48.7 48.9 50.2 50.0 50.4 517 522 50.0 50.5 49.7 49.0 49.7 51.8 52.7 55.2 54.1 509 512 51.0 50.8 50.6 51.2 (conto SUPPLEMENT 6 STATISTICAL PROCESS CONTROL 313 RANGE RANGE AVERAGE WEIGHT (POUNDS) TIME LARGEST 46.4 49.7 6:00 PM 700 8.00 9.00 w TIME 6:00 AM 7:00 8:00 9.00 9.00 10:00 11:00 12 noon Fenon 1:00 PM 2:00 3.00 4.00 5.00 AVERAGE WEIGHT (POUNDS) 48.6 50.0 49.8 3.0 503 50 2 30.4 50.0 500 50.1 49.7 48.4 472 46.8 SMALLEST 474 492 492 49.0 49.4 20 49.6 49.0 48.8 49.4 48.6 472 45.3 441 LARGEST 52.0 522 342 524 524 51.7 518 52.3 52.4 53.6 51.0 51.7 50.9 49.0 10.00 11:00 SMALLEST 440 444 466 472 481 40 420 46.4 468 472 49.0 50.5 50.0 46.4 46. 472 472 48.4 10. 49.2 48.4 472 47.4 48.8 49.6 51.0 505 12 midnight 1:00 AM 2.00 3.00 4.00 5.00 500 su 489 495 22 507 508 492 49 51.4 506 515 519 The additional night-shift bagging crew was staffed entirely by new employees. The most experienced foremen were temporarily assigned to supervise the night-shift employees. Most emphasis was placed on increasing the output of bags to meet ever-increas ing demand. It was suspected that only occasional reminders were made to double-check the bag weight-feeder. (A double-check is performed by systematically weighing a a bag on a scale to deter- mine if the proper weight is being ! eing loaded by the weight-feeder. If there is significant deviation from 50 pounds, corrective adjust- ments are made to the weight-release mechanism.) To verify this expectation, the quality control staff randomly sampled the bag output and prepared the chart on the previous page. Six bags were sampled and weighed each hour Discussion Questions 1. What control charts should be used to determine whether the process is in control or out of control? 2. Develop a control chart for each shift. Does there appear to be a difference between the shifts? 3. Cecil Rice Export is planning on providing incentives for senior personnel to rotate into other shifts to better mix per- sonnel among the shifts. If the same control charts were used for all three shifts, what would be the control limits of these charts? Source: Dr. Ian M. Langella, Shippensburg University, USA Frito-Lay's Quality Controlled Potato Chips Video Case assurance staff. They watch all aspects of quality, including training employees on the factory floor, monitoring automated processing equipment, and developing and updating statistical process control (SPC) charts. The upper and lower controllim. its for one checkpoint, salt content in Lay's chips, are 2.22% and 1.98%, respectively. To see exactly how these limits are created using SPC. watch the video that accompanies this case, carton filling in the Frito-Lay, the multi-billion-dollar snack food giant, produces bil- lions of pounds of product every year at its dozens of U.S. and Canadian plants. From the farming of potatoes in Florida. North Carolina, and Michigan-to factory and to retail stores, the ingredients and final product of Lay's chips, for example, are inspected at least 11 times in the field, before unloading at the plant, after washing and peeling, at the sizing station, at the fryer, after seasoning, when bagged (for weight), at carton warehouse, and as they are placed on the store shelf by Frito- Lay personnel. Similar inspections take place for its other famous products, including Cheetos, Fritos. Ruffles, and Tostitos. In addition to these employee inspections, the firm uses pro prietary vision systems to look for defective potato chips. Chips are pulled off the high-speed line and checked twice if the vision system senses them to be too brown. The company follows the very strict standards of the American Institute of Baking (AIB), standards that are much tougher than those of the US Food and Drug Administration. Two unan- nounced AIB site visits per year keep Frito-Lay's plants on their toes. Scores, consistently in the "excellent" range, are posted, and every employee knows exactly how the plant is doing There are two key metrics in Frito Lay's continuous improve ment quality program: (1) total customer complaints (measured on a complaints per million bag basis) and (2) hourly or daily sta- tistical process control scores (for oil moisture, seasoning, and salt content for chip thickness, for fryer temperature, and for weight) In the Florida plant, Angela McCormack, who holds engineering and MBA degrees, oversees a 15-member quality Discussion Questions 1. Angela is now going to evaluate a new salt process delivery sys- tem and wants to know if the upper and lower control limits at 3 standard deviations for the new system will meet the upper and lower control specifications noted earlier. The data (in percents) from the initial trial samples are: Sample 1: 1.98, 2.11.2.15. 2.06 Sample 2: 1.99, 2.0, 2.08. 1.99 Sample 3: 2.20.2.10.2.20, 2.05 Sample 4: 2.18,2.01. 2.23. 1.98 Sample 3:2.01. 2.08, 2.14.2.16 Provide the report to Angela 2. What are the advantages and disadvantages of Frito Lay driv- ers stocking their customers' shelves? 3. Why is quality a critical function at Frito-Lay? *You may wish to view the video that accompanies this case before answering these questions
Step by Step Solution
There are 3 Steps involved in it
1 Expert Approved Answer
Step: 1 Unlock

Question Has Been Solved by an Expert!
Get step-by-step solutions from verified subject matter experts
Step: 2 Unlock
Step: 3 Unlock