

Question: 3.13 (a) Use Excel to prepare a line chart to display the lightning death data. Modify the default colors, fonts, etc., as you judge appropriate

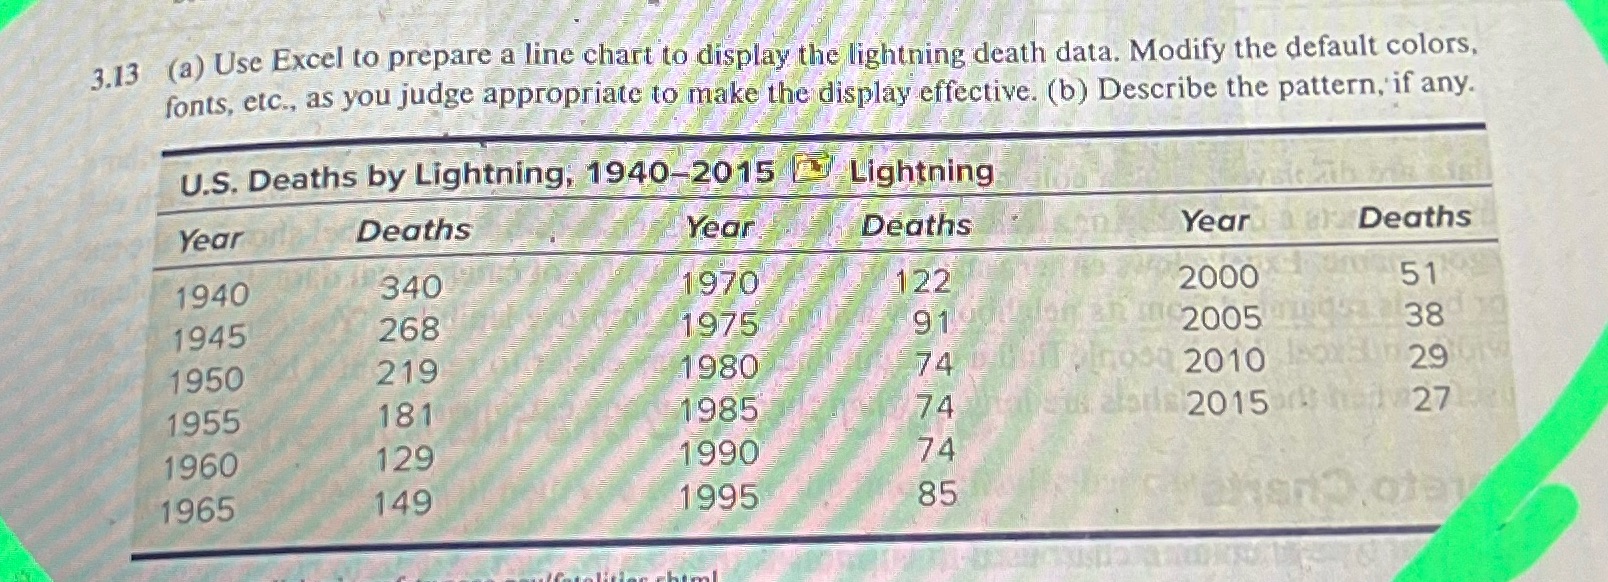
3.13 (a) Use Excel to prepare a line chart to display the lightning death data. Modify the default colors, fonts, etc., as you judge appropriate to make the display effective. (b) Describe the pattern, if any. U.S. Deaths by Lightning, 1940-2015 4 Lightning Year Deaths Year Deaths Year Deaths 1940 340 1970 122 2000 51 1945 268 1975 2005 38 1950 219 1980 2010 29 1955 181 1985 74 2015 27 1960 129 1990 74 1965 149 1995 85
Step by Step Solution
There are 3 Steps involved in it
1 Expert Approved Answer
Step: 1 Unlock

Question Has Been Solved by an Expert!
Get step-by-step solutions from verified subject matter experts
Step: 2 Unlock
Step: 3 Unlock