

Question: 3.1CREATE and INTERPRET a histogram using the variable GasMoney (Amount of money spent on gas every week) i have already done the excel just need
3.1CREATE and INTERPRET a histogram using the variable GasMoney (Amount of money spent on gas every week) i have already done the excel just need help with the math. 3.2. CREATE and INTERPRET the graph that best represents the vanableStatsDifficulty (On a scale of 1 to 5, how difficult do you find this stats class?).Values and frequencies are displayed below:
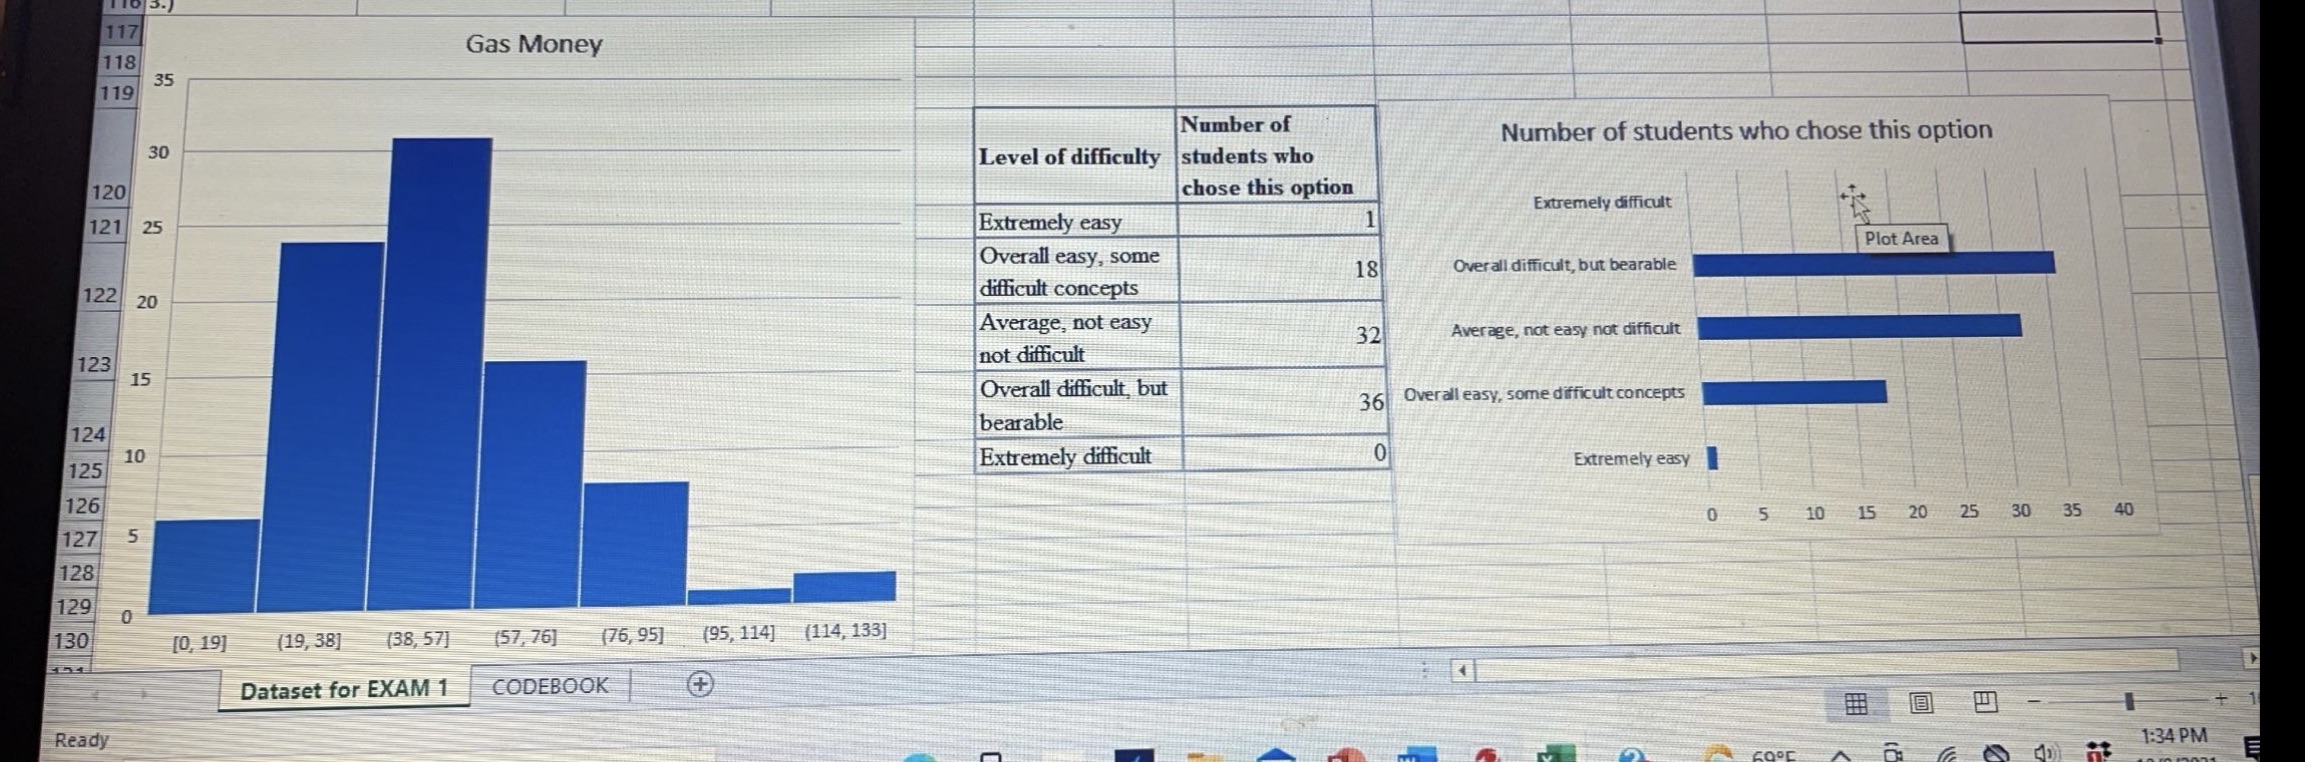
117 Gas Money 118 35 11 Number of Number of students who chose this option 30 Level of difficulty students who 120 chose this option Extremely difficult 121 25 Extremely easy Plot Area Overall easy, some 18 Overall difficult, but bearable 122 20 difficult concepts Average, not easy 32 Average, not easy not difficult 123 not difficult 15 Overall difficult, but 36 Overall easy, some difficult concepts 124 bearable 10 Extremely difficult 125 Extremely easy 126 0 5 10 15 20 25 30 35 40 127 5 128 129 0 130 [0, 19] (19, 38] (38, 57] (57, 76] (76, 95] (95, 114] (114, 133] Dataset for EXAM 1 CODEBOOK + Ready 1:34 PM
Step by Step Solution
There are 3 Steps involved in it

Get step-by-step solutions from verified subject matter experts