

Question: 33. Below is a StatCrunch output showing the summary statistics for the probability test. We want to compare test scores in online classes and virtual
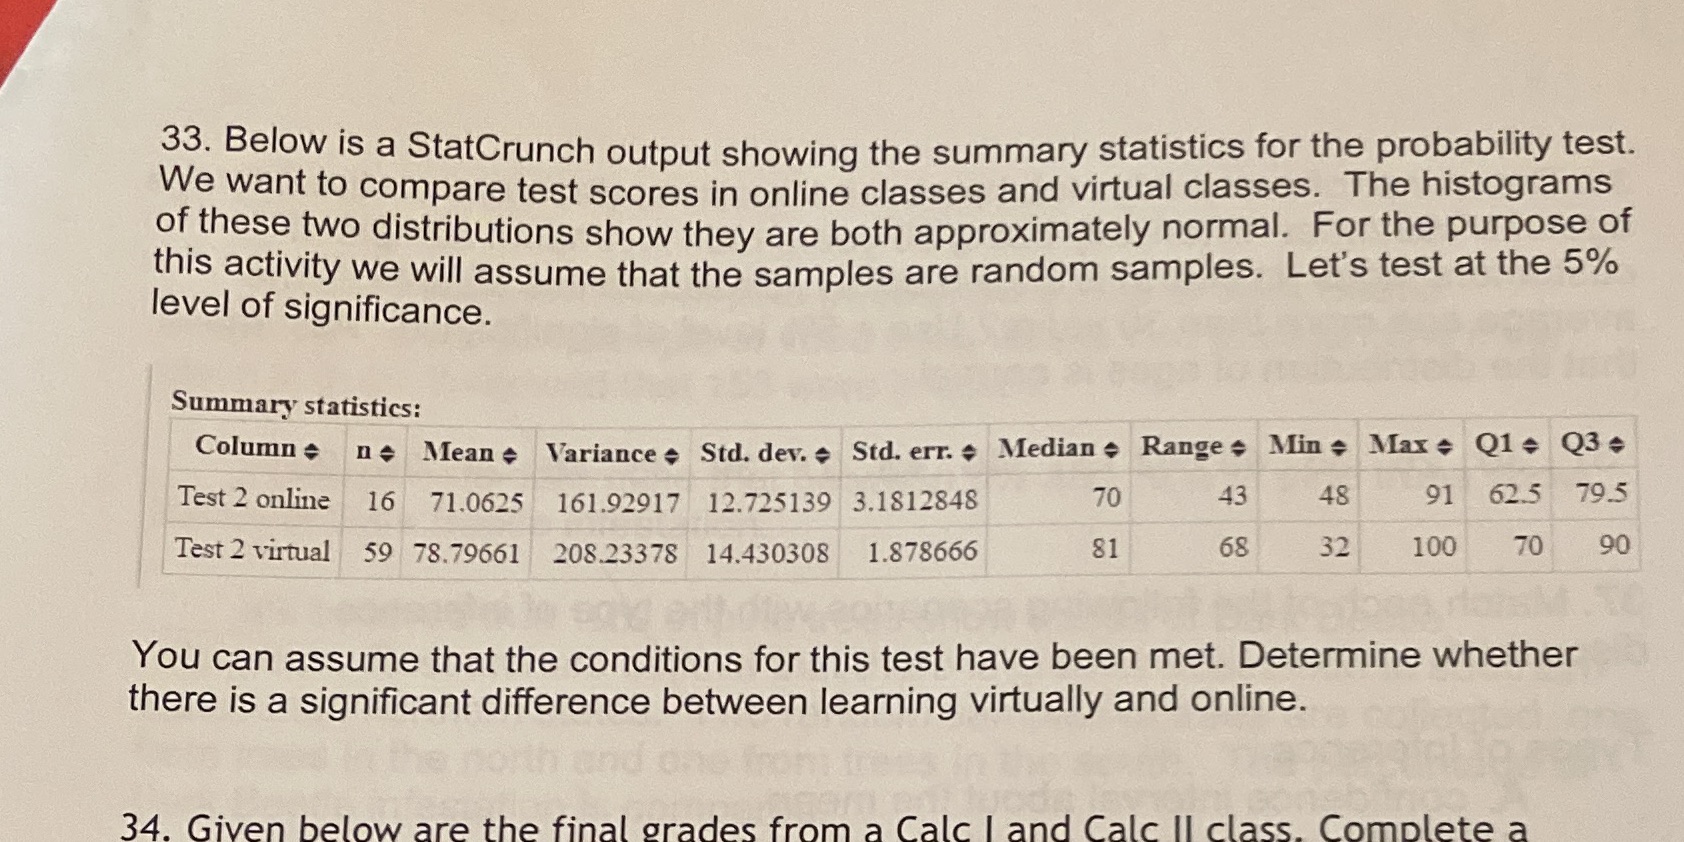
33. Below is a StatCrunch output showing the summary statistics for the probability test. We want to compare test scores in online classes and virtual classes. The histograms of these two distributions show they are both approximately normal. For the purpose of this activity we will assume that the samples are random samples. Let's test at the 5% level of significance. Summary statistics: Column . ne Mean . Variance . Std. dev. . Std. err. . Median . Range . Mine Max e Q1 + Q3 Test 2 online 16 71.0625 161.92917 12.725139 3.1812848 70 43 48 91 62.5 79.5 Test 2 virtual 59 78.79661 208.23378 14.430308 1.878666 81 68 32 100 70 90 You can assume that the conditions for this test have been met. Determine whether there is a significant difference between learning virtually and online. 34. Given below are the final grades from a Calc I and Calc II class. Complete a
Step by Step Solution
There are 3 Steps involved in it

Get step-by-step solutions from verified subject matter experts