

Question: 3-4. Figure 3-28 has data from a Traceroute analysis. a) Add a third column showing the change in latency between the router in that row
3-4. Figure 3-28 has data from a Traceroute analysis. a) Add a third column showing the change in latency between the router in that row and the router in the preceding row. (Check figure: The change for Router 2 from Router 3 is zero.) Shade the row for any large latency problem or problems you find. b) For the first problem you find, state whether the problem might be in the router in the row, in the previous router, or something else.
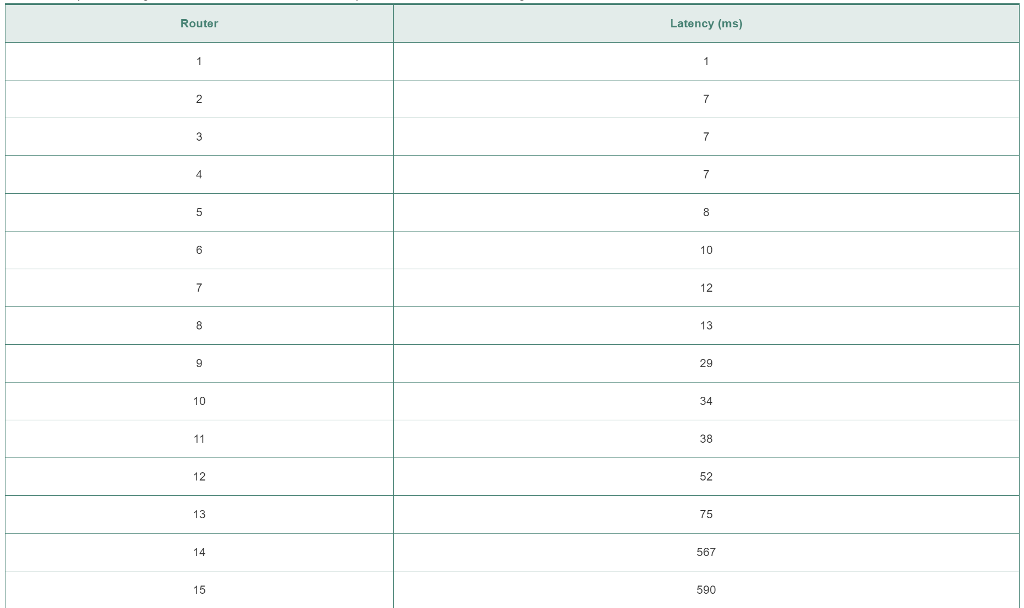
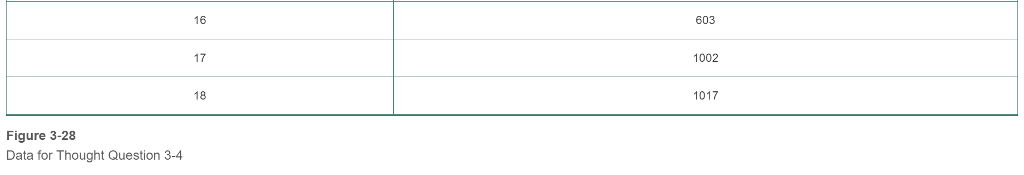
Latency (ms) Router 10 38 52 12 14 590 15 16 603 17 1002 18 1017 Figure 3-28 Data for Thought Question 3-4
Step by Step Solution
There are 3 Steps involved in it
1 Expert Approved Answer
Step: 1 Unlock

Question Has Been Solved by an Expert!
Get step-by-step solutions from verified subject matter experts
Step: 2 Unlock
Step: 3 Unlock