

Question: Figure 3-28 has data from a Traceroute analysis. a) Add a third column showing the change in latency between the router in that row and
Figure 3-28 has data from a Traceroute analysis. a) Add a third column showing the change in latency between the router in that row and the router in the preceding row. (Check figure: The change for Router 2 from Router 3 is zero.) Shade the row for any large latency problem or problems you find. b) For the first problem you find, state whether the problem might be in the router in the row, in the previous router, or something else.
Create a spreadsheet with the data and your computations, and submit the spreadsheet with your answers.
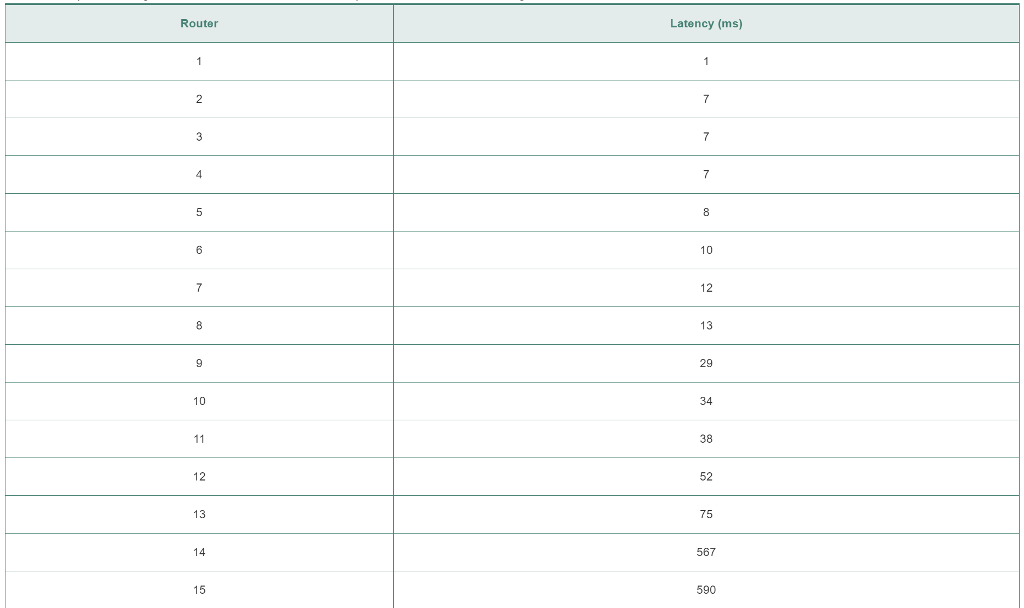
Router Latency (ms) 1 1 2 7 3 7 4 7 5 8 6 10 7 12 8 13 9 29 10 34 11 38 12 52 13 75 14 567 15 590 Router Latency (ms) 1 1 2 7 3 7 4 7 5 8 6 10 7 12 8 13 9 29 10 34 11 38 12 52 13 75 14 567 15 590
Step by Step Solution
There are 3 Steps involved in it

Get step-by-step solutions from verified subject matter experts