

Question: 34. NOTE THAT THIS TABLE IS USED FOR MULTIPLE QUESTIONS. IT WILL HELP YOU TO COPY THE NUMBERS DOWN OR PUT THEM IN A SPREADSHEET.
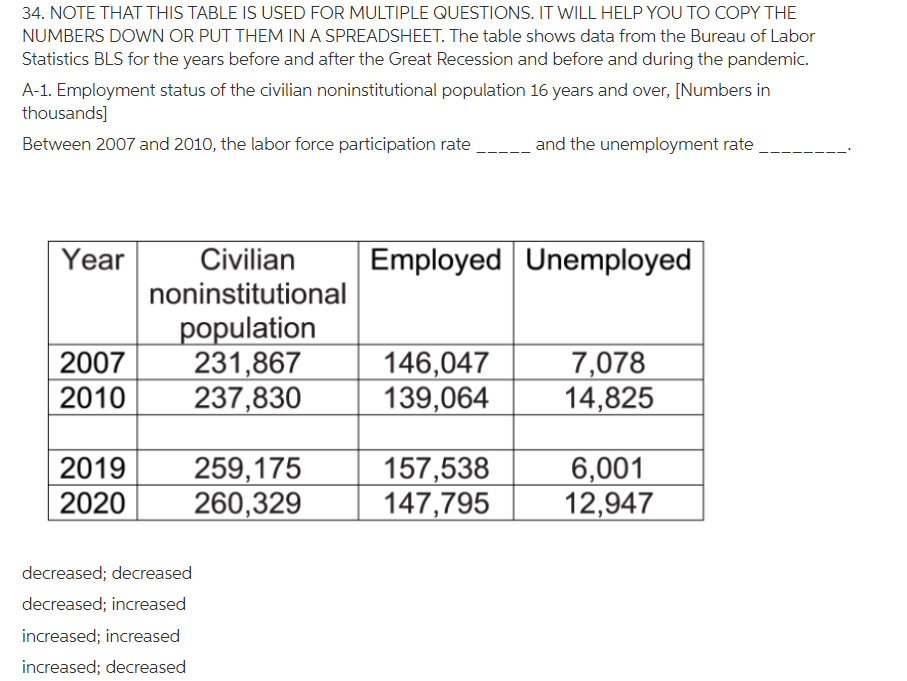
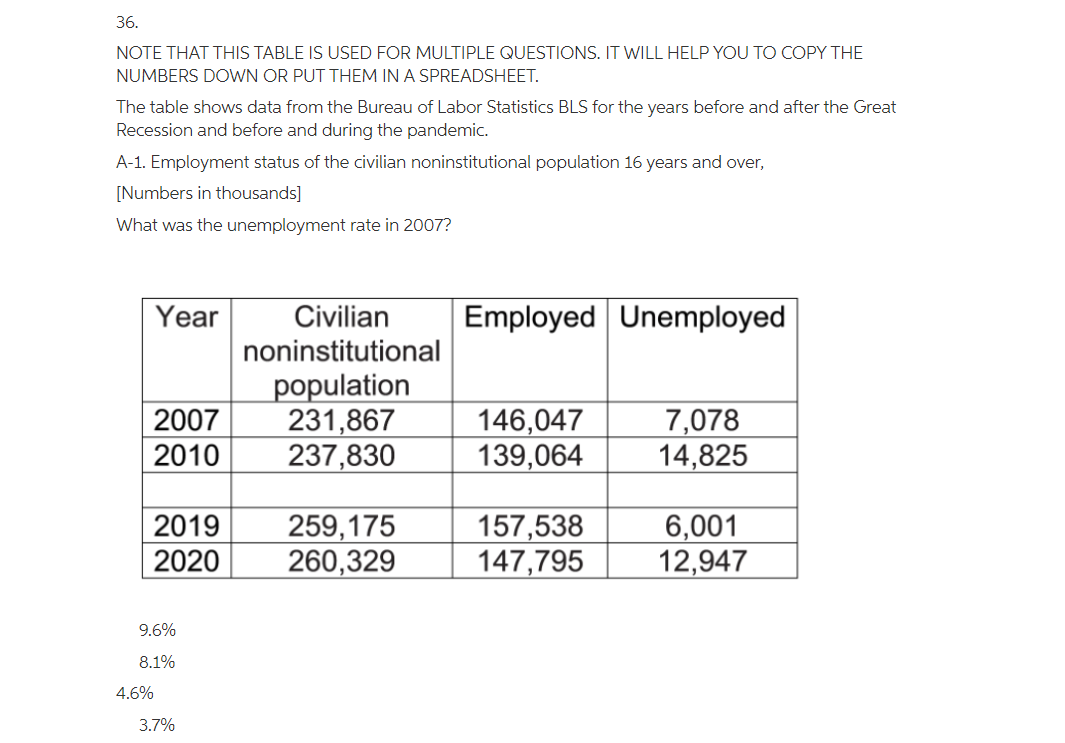
34. NOTE THAT THIS TABLE IS USED FOR MULTIPLE QUESTIONS. IT WILL HELP YOU TO COPY THE NUMBERS DOWN OR PUT THEM IN A SPREADSHEET. The table shows data from the Bureau of Labor Statistics BLS for the years before and after the Great Recession and before and during the pandemic. A-1. Employment status of the civilian noninstitutional population 16 years and over, [Numbers in thousands] Between 2007 and 2010, the labor force participation rate _ and the unemployment rate Year Civilian Employed Unemployed noninstitutional population 2007 231,867 146,047 7,078 2010 237,830 139,064 14,825 2019 259, 175 157,538 6,001 2020 260,329 147,795 12,947 decreased; decreased decreased; increased increased; increased increased; decreased36. NOTE THAT THIS TABLE IS USED FOR MULTIPLE QUESTIONS. IT WILL HELP YOU TO COPY THE NUMBERS DOWN OR PUT THEM IN A SPREADSHEET. The table shows data from the Bureau of Labor Statistics BLS for the years before and after the Great Recession and before and during the pandemic. Al. Employment status of the civilian noninstitutional population 16 years and over, [Numbers in thousands] What was the unemployment rate in 2007? Year Civilian Employed Unemployed 2007 231 ,867 146,047 7,078 2010 237,830 139,064 14,825 -_ 2019 259,175 157,538 In]- Em 260,329 147,795 12,947 9.6% 8 .196 4.6% 3.7%
Step by Step Solution
There are 3 Steps involved in it

Get step-by-step solutions from verified subject matter experts