Question: 35, 3.37 Saved Help Save & Exit Submit Check my work Exercise 3-35 Static The accompanying table shows a portion of the average SAT math
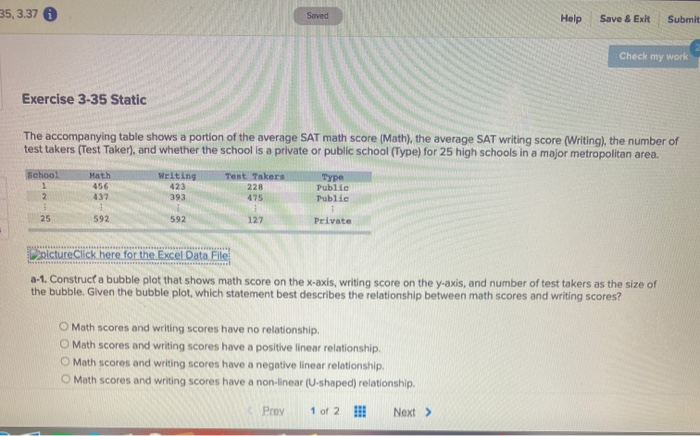
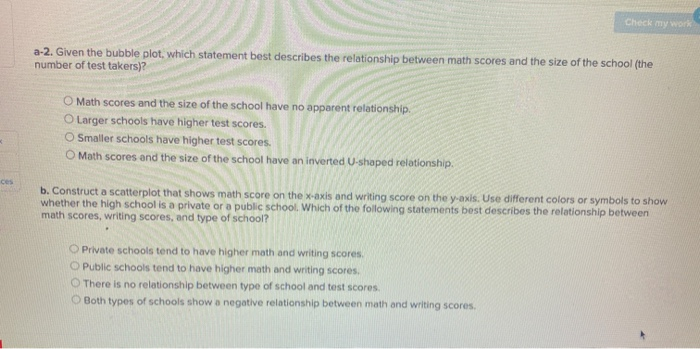
35, 3.37 Saved Help Save & Exit Submit Check my work Exercise 3-35 Static The accompanying table shows a portion of the average SAT math score (Math), the average SAT writing score (Writing), the number of test takers (Test Taker), and whether the school is a private or public school (Type) for 25 high schools in a major metropolitan area. School 1 2 Math 456 Writing 423 393 Test Takers 228 475 Type Public Public 437 25 592 592 127 Private picture Click here for the Excel Data File a-1. Construct a bubble plot that shows math score on the x-axis, writing score on the y-axis, and number of test takers as the size of the bubble. Given the bubble plot, which statement best describes the relationship between math scores and writing scores? Math scores and writing scores have no relationship O Moth scores and writing scores have a positive linear relationship. O Math scores and writing scores have a negative linear relationship. O Math scores and writing scores have a non-linear (U-shaped) relationship, Prev 1 of 2 Next > Check my work a-2. Given the bubble plot, which statement best describes the relationship between math scores and the size of the school (the number of test takers)? O Math scores and the size of the school have no apparent relationship. O Larger schools have higher test scores. O Smaller schools have higher test scores. Math scores and the size of the school have an inverted U-shaped relationship, ces b. Construct a scatterplot that shows math score on the x-axis and writing score on the y-axis. Use different colors or symbols to show whether the high school is a private or a public school. Which of the following statements best describes the relationship between math scores, writing scores, and type of school? Private schools tend to have higher math and writing scores O Public schools tend to have higher math and writing scores. There is no relationship between type of school and test scores Both types of schools show a negative relationship between math and writing scores 35, 3.37 Saved Help Save & Exit Submit Check my work Exercise 3-35 Static The accompanying table shows a portion of the average SAT math score (Math), the average SAT writing score (Writing), the number of test takers (Test Taker), and whether the school is a private or public school (Type) for 25 high schools in a major metropolitan area. School 1 2 Math 456 Writing 423 393 Test Takers 228 475 Type Public Public 437 25 592 592 127 Private picture Click here for the Excel Data File a-1. Construct a bubble plot that shows math score on the x-axis, writing score on the y-axis, and number of test takers as the size of the bubble. Given the bubble plot, which statement best describes the relationship between math scores and writing scores? Math scores and writing scores have no relationship O Moth scores and writing scores have a positive linear relationship. O Math scores and writing scores have a negative linear relationship. O Math scores and writing scores have a non-linear (U-shaped) relationship, Prev 1 of 2 Next > Check my work a-2. Given the bubble plot, which statement best describes the relationship between math scores and the size of the school (the number of test takers)? O Math scores and the size of the school have no apparent relationship. O Larger schools have higher test scores. O Smaller schools have higher test scores. Math scores and the size of the school have an inverted U-shaped relationship, ces b. Construct a scatterplot that shows math score on the x-axis and writing score on the y-axis. Use different colors or symbols to show whether the high school is a private or a public school. Which of the following statements best describes the relationship between math scores, writing scores, and type of school? Private schools tend to have higher math and writing scores O Public schools tend to have higher math and writing scores. There is no relationship between type of school and test scores Both types of schools show a negative relationship between math and writing scores