

Question: 35)answer pls Complete the code to produce a graph with a title and proper labels for each axis. plot,plot (x[:,0],x[:,2], edgecolors= black', c=y) plot.ylabel ('Sepal
35)answer pls 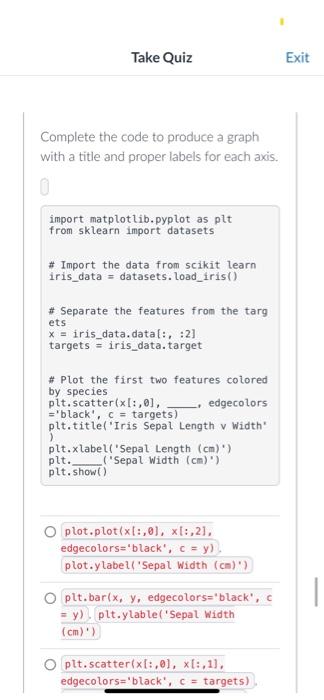
![and proper labels for each axis. plot,plot (x[:,0],x[:,2], edgecolors= "black', c=y) plot.ylabel](https://dsd5zvtm8ll6.cloudfront.net/si.experts.images/questions/2024/09/66f2f2eaa74fe_93066f2f2ea44b1f.jpg)
Complete the code to produce a graph with a title and proper labels for each axis. plot,plot (x[:,0],x[:,2], edgecolors= "black', c=y) plot.ylabel ('Sepal Width (cm)) plt. bar (x,y, edgecolors=" black', c = y). plt.ylable ('Sepal width (cm)) plt. plt. show ('Sepal Width (cm)') plot.plot (x[:,0],x[:,2], edgecolors='black', c=y). plot.ylabel('Sepal Width (cm)) plt.bar(x, y, edgecolors='black', =y), plt.ylable('Sepal Width (cm)) plt. scatter (x[:,0],x[:,1], edgecolors='black', c= targets). plt.ylabel('Sepal Width (cm)')
Step by Step Solution
There are 3 Steps involved in it
1 Expert Approved Answer
Step: 1 Unlock

Question Has Been Solved by an Expert!
Get step-by-step solutions from verified subject matter experts
Step: 2 Unlock
Step: 3 Unlock