

Question: 3-6 Cash Flow Statement Case Problem The following is the Balance Sheet and Income Statement of a publicly traded company. Use the financial statements to
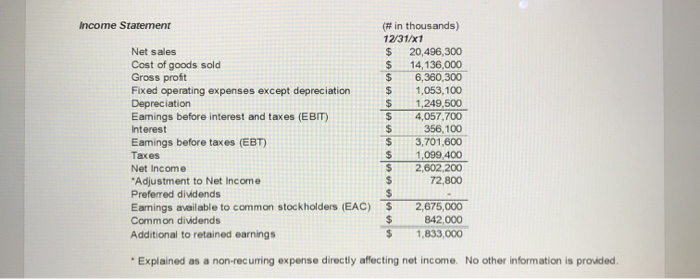
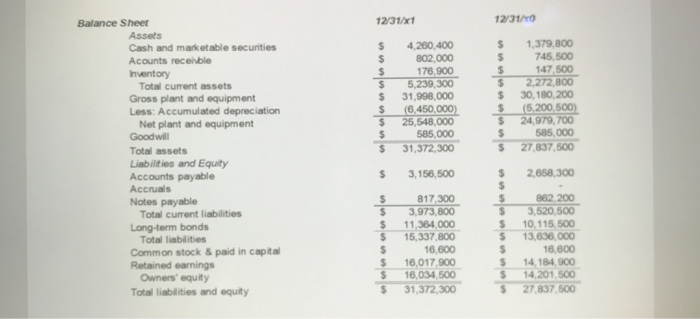
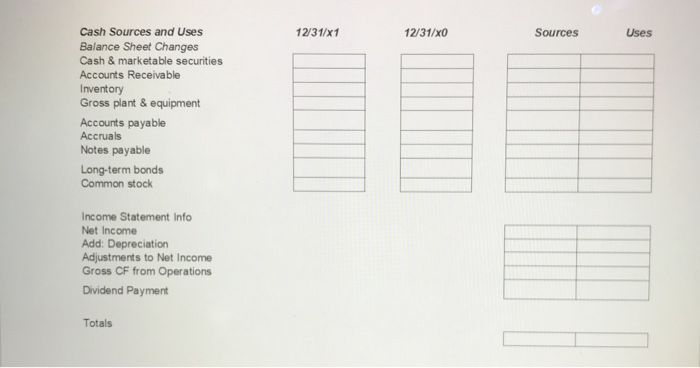
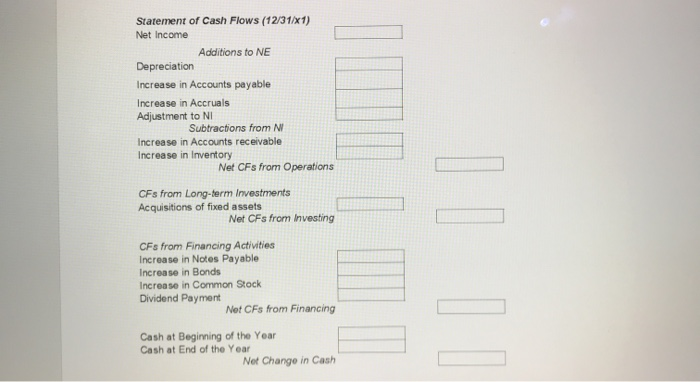
3-6 Cash Flow Statement Case Problem The following is the Balance Sheet and Income Statement of a publicly traded company. Use the financial statements to first complete the sources/uses worksheet and then translate that into a Statement of Cash Flows for this company. Assess the general health of this company by answering the following: 1 - Where is cash generated? 2- Where is it used? 3 - What are the strengths/weaknesses of this company? 4 - Assuming the company is in the mature portion of its life cycle, what would you suggest the company do differently to emphasize it strengths and mitigate its weaknesses? Income Statement Net sales Cost of goods sold Gross profit Fixed operating expenses except depreciation Depreciation Eamings before interest and taxes (EBIT) Interest Eamings before taxes (EBT) Taxes Net Income *Adjustment to Net Income Preferred dividends Earnings available to common stockholders (EAC) Common dividends Additional to retained earnings (# in thousands) 12/31/X1 $ 20,496,300 $ 14,136,000 $ 6,360,300 $ 1,053, 100 $ 1,249,500 $ 4,057,700 $ 356,100 $ 3,701,600 $ 1,099,400 $ 2,602,200 $ 72,800 $ $ 2,675,000 $ 842,000 $ 1,833,000 * Explained as a non-recurring expense directly affecting net income. No other information is provided 12/31/X1 12/31/ $ $ $ $ $ $ $ $ $ 4,200,400 802,000 178,900 5,239,300 31,990,000 (6,450,000) 25,548,000 585,000 31,372,300 $ $ $ $ $ $ $ $ $ 1.379,800 745,500 147,500 2.272,800 30, 180, 200 (5.200, 500) 24,979,700 585,000 27.837.500 Balance Sheer Assets Cash and marketable securities Acounts receivble Inventory Total current assets Gross plant and equipment Less: Accumulated depreciation Net plant and equipment Goodwill Total assets Liabilities and Equity Accounts payable Accruals Notes payable Total current liabilities Long-term bonds Total liabilities Common stock & paid in capital Retained earnings Owners' equity Total liabilities and equity $ 3,156,500 2.658,300 $ $ $ $ $ $ $ $ 817300 3,973,800 11,364,000 15,337,800 16,600 16,017,900 16,034,500 31,372,300 $ $ $ $ S $ $ $ $ $ 862,200 3,520,500 10,115,500 13,836,000 16.800 14.184,900 14,201.500 27.837,500 12/31/X1 12/31/x0 Sources Uses Cash Sources and Uses Balance Sheet Changes Cash & marketable securities Accounts Receivable Inventory Gross plant & equipment Accounts payable Accruals Notes payable Long-term bonds Common stock Income Statement Info Net Income Add: Depreciation Adjustments to Net Income Gross CF from Operations Dividend Payment Totals Statement of Cash Flows (12/31/x 1) Net Income Additions to NE Depreciation Increase in Accounts payable Increase in Accruals Adjustment to NI Subtractions from NV Increase in Accounts receivable Increase in Inventory Net CFs from Operations CFs from Long-term Investments Acquisitions of fixed assets Net CFs from Investing CFs from Financing Activities Increase in Notes Payable Increase in Bonds Increase in Common Stock Dividend Payment Net CFs from Financing Cash at Beginning of the Year Cash at End of the Year Net Change in Cash
Step by Step Solution
There are 3 Steps involved in it

Get step-by-step solutions from verified subject matter experts