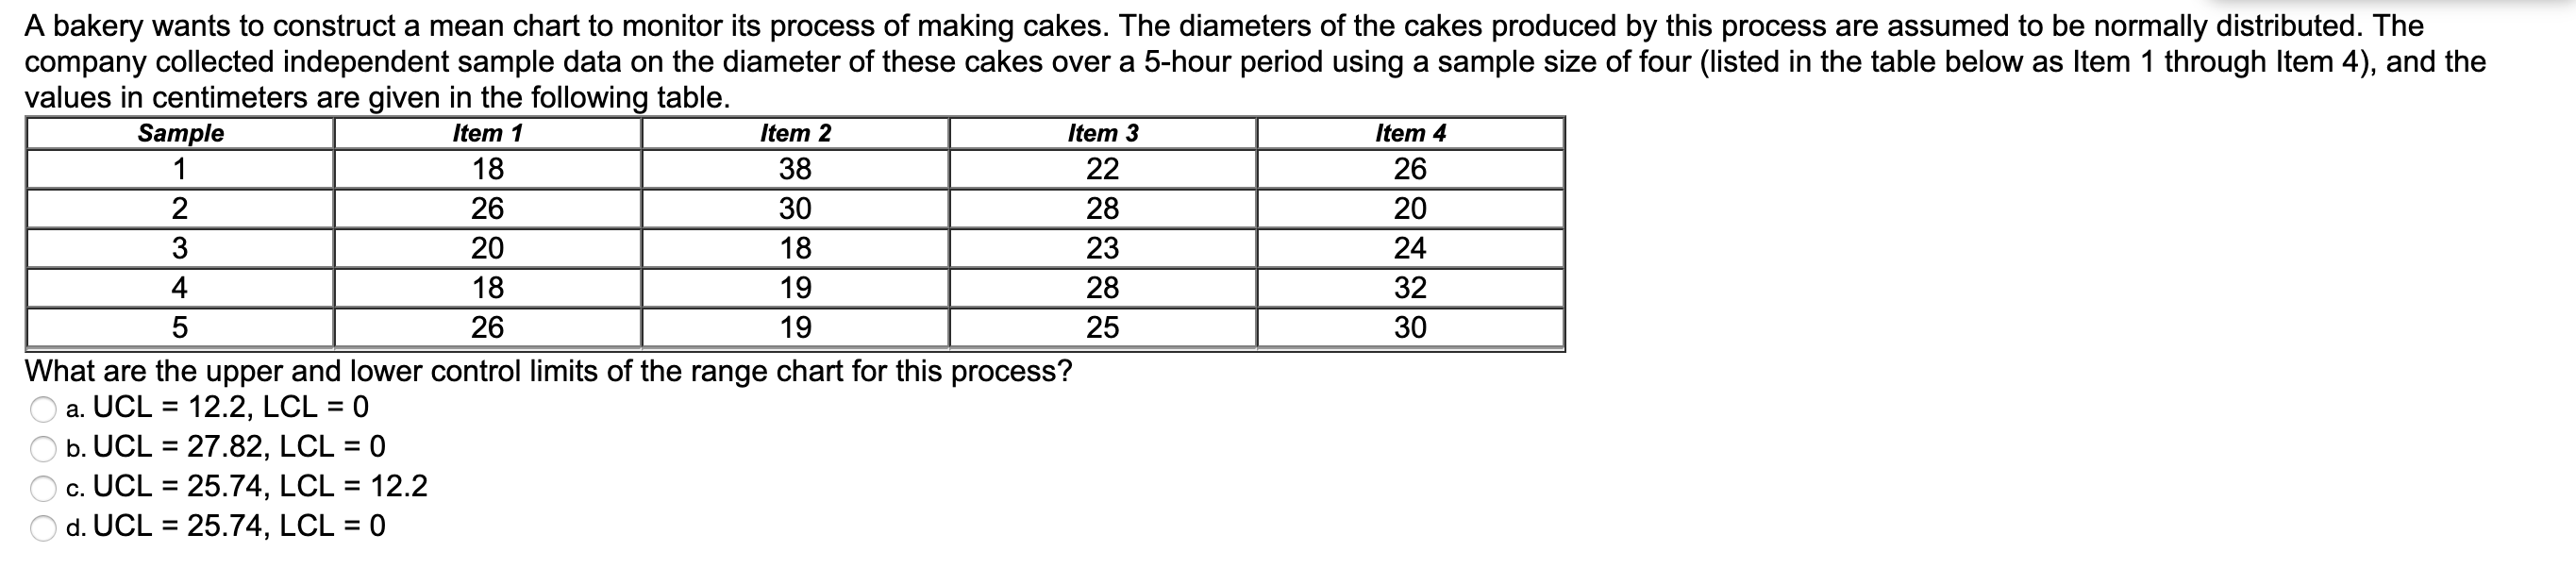
Question: 38 18 A bakery wants to construct a mean chart to monitor its process of making cakes. The diameters of the cakes produced by this

38 18 A bakery wants to construct a mean chart to

38 18 A bakery wants to construct a mean chart to monitor its process of making cakes. The diameters of the cakes produced by this process are assumed to be normally distributed. The company collected independent sample data on the diameter of these cakes over a 5-hour period using a sample size of four (listed in the table below as Item 1 through Item 4), and the values in centimeters are given in the following table. Sample Item 1 Item 2 Item 3 Item 4 18 22 26 26 30 28 20 20 23 24 18 28 32 5 26 19 30 What are the upper and lower control limits of the range chart for this process? O a. UCL = 12.2, LCL = 0 O b. UCL = 27.82, LCL = 0 c. UCL = 25.74, LCL = 12.2 O d. UCL = 25.74, LCL = 0 19 25

Step by Step Solution

There are 3 Steps involved in it

1 Expert Approved Answer
Step: 1 Unlock blur-text-image
Question Has Been Solved by an Expert!

Get step-by-step solutions from verified subject matter experts

Step: 2 Unlock
Step: 3 Unlock

Students Have Also Explored These Related General Management Questions!