

Question: = 381828_group assignment.pdf 2 / 7 100% + INSTRUCTIONS Section 1 - Financial Analysis FSA Company's Summary Financial Data In billions, except per share data)
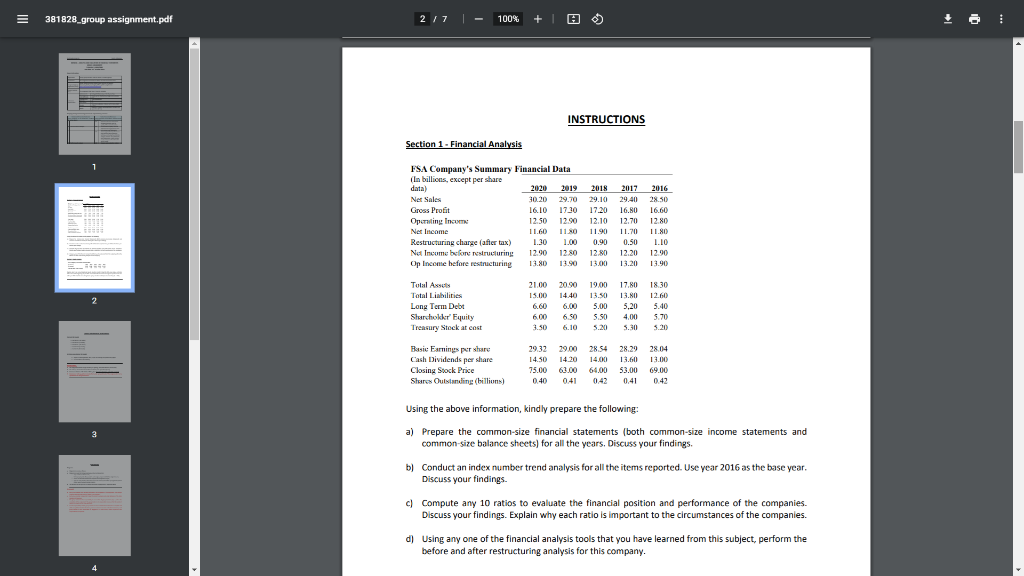
= 381828_group assignment.pdf 2 / 7 100% + INSTRUCTIONS Section 1 - Financial Analysis FSA Company's Summary Financial Data In billions, except per share data) 2020 2019 2018 2017 Net Sales 30.20 29.70 29.10 29.40 Gross Prot 16.10 17 10 17.20 16.80 Operating In 12.50 12.90 12.10 12.70 Net Income 1160 11.30 11.90 11.70 Restructuring charge (after tax) 1.30 1.00 0.90 0.50 Not Income before restructuring 1290 1280 12.80 12.20 Op Income before restructuring 13.80 13.50 13.00 13.20 2016 28.50 16.60 12.80 11.80 1.10 12.90 13.90 Total Assess Total Liabilities Long Term Debt Sluchokker' Equity Treasury Stock at cost 21.00 15.00 6.00 600 3.50 20.90 14.40 6.00 2 19.00 13.50 5.00 17.80 13.00 5,20 4,00 5.30 1830 12.60 5.40 5.70 3.20 6.90 6.10 S.SO S.M 79.00 Basic Earnings prstare Cash Dividends per share Closing Stock Price Shures Outstanding (billions) 29.32 14.50 75.00 0.40 14.20 61.00 0.41 28.54 14.00 64.00 0.42 28.29 13.60 53.00 0.41 2814 13.00 69.00 41 Using the above information, kindly prepare the following: 3 a) Prepare the common-size financial statements (both common-size income statements and common-size balance sheets) for all the years, Discuss your findings. ) , . b) Conduct an index number trend analysis for all the items reported. Use year 2016 as the base year. Discuss your findings c) Compute any 10 ratios to evaluate the financial position and performance of the companies. Discuss your findings. Explain why each ratio is important to the circumstances of the companies. d) Using any one of the financial analysis tools that you have learned from this subject, perform the before and after restructuring analysis for this company. = 381828_group assignment.pdf 2 / 7 100% + INSTRUCTIONS Section 1 - Financial Analysis FSA Company's Summary Financial Data In billions, except per share data) 2020 2019 2018 2017 Net Sales 30.20 29.70 29.10 29.40 Gross Prot 16.10 17 10 17.20 16.80 Operating In 12.50 12.90 12.10 12.70 Net Income 1160 11.30 11.90 11.70 Restructuring charge (after tax) 1.30 1.00 0.90 0.50 Not Income before restructuring 1290 1280 12.80 12.20 Op Income before restructuring 13.80 13.50 13.00 13.20 2016 28.50 16.60 12.80 11.80 1.10 12.90 13.90 Total Assess Total Liabilities Long Term Debt Sluchokker' Equity Treasury Stock at cost 21.00 15.00 6.00 600 3.50 20.90 14.40 6.00 2 19.00 13.50 5.00 17.80 13.00 5,20 4,00 5.30 1830 12.60 5.40 5.70 3.20 6.90 6.10 S.SO S.M 79.00 Basic Earnings prstare Cash Dividends per share Closing Stock Price Shures Outstanding (billions) 29.32 14.50 75.00 0.40 14.20 61.00 0.41 28.54 14.00 64.00 0.42 28.29 13.60 53.00 0.41 2814 13.00 69.00 41 Using the above information, kindly prepare the following: 3 a) Prepare the common-size financial statements (both common-size income statements and common-size balance sheets) for all the years, Discuss your findings. ) , . b) Conduct an index number trend analysis for all the items reported. Use year 2016 as the base year. Discuss your findings c) Compute any 10 ratios to evaluate the financial position and performance of the companies. Discuss your findings. Explain why each ratio is important to the circumstances of the companies. d) Using any one of the financial analysis tools that you have learned from this subject, perform the before and after restructuring analysis for this company
Step by Step Solution
There are 3 Steps involved in it

Get step-by-step solutions from verified subject matter experts