

Question: INSTRUCTIONS Section 1 - Financial Analysis FSA Company's Summary Financial Data (In billions, except per share data) 2020 2019 Net Sales 30,20 29.70 Gross Profit
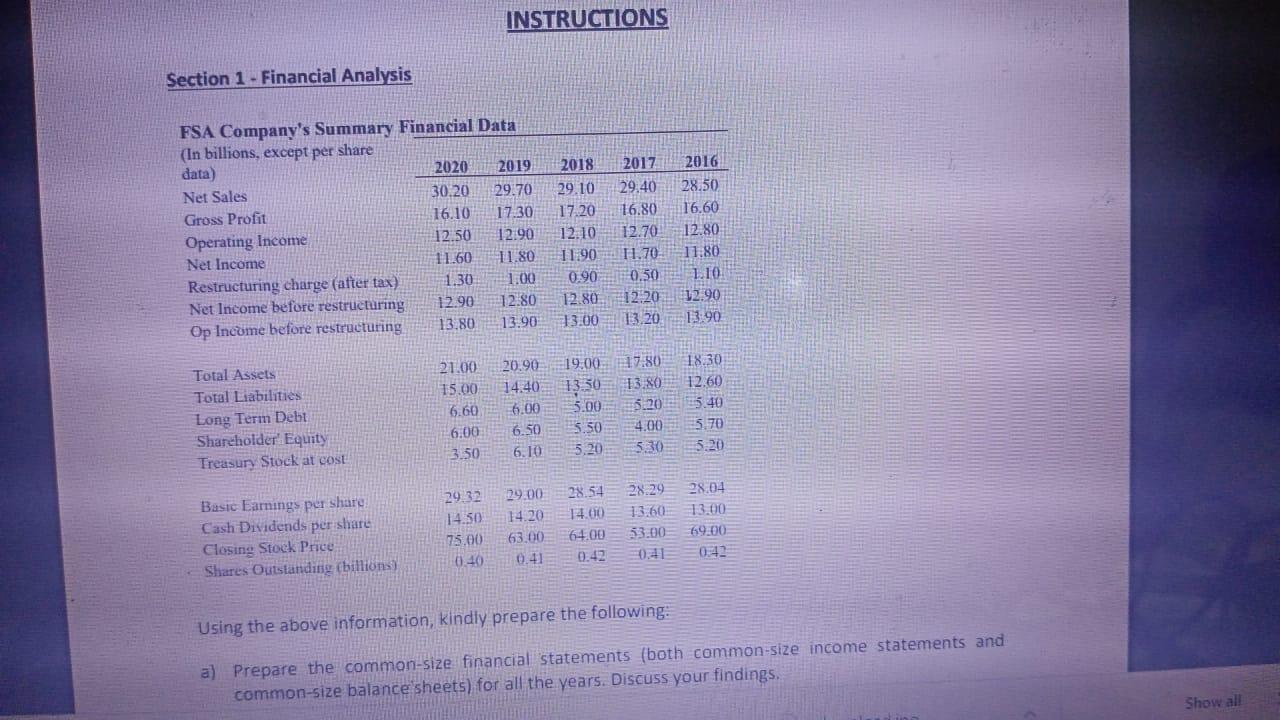
INSTRUCTIONS Section 1 - Financial Analysis FSA Company's Summary Financial Data (In billions, except per share data) 2020 2019 Net Sales 30,20 29.70 Gross Profit 16.10 17.30 Operating Income 12.50 12.90 Net Income 11.60 11.80 Restructuring charge (after tax) 1.30 1.00 Net Income before restructuring 12.90 12.80 Op Income before restructuring 13.80 13.90 2018 29.10 17.20 12.10 11:90 0.90 12.80 13.00 2017 29.40 16.80 12.70 11.70 0.50 12.20 13.20 2016 28.50 16.60 12.80 11.80 1.10 12.90 1:90 21.00 15.00 6.60 Total Assets Total Liabilities Long Term Debt Shareholder' Equity Treasun Stock at cost 20.90 19.00 14:40 13.50 6.00 5.00 6.50 3.50 6.10 5.20 17.80 13.30 5.20 4.00 5.30 18.30 12.60 5.40 5.70 5.20 6.00 3.50 28.29 13.60 Basic Earnings per share Cash Dividends per share Closing Stock Price Shares Outstanding billions) 29:32 14.50 75.00 040 29.00 14.20 63.00 0.41 28.54 14.00 64.00 28.04 13.00 69.00 02 53.00 0.41 Using the above information, kindly prepare the following: a) Prepare the common-size financial statements (both common-size income statements and common-size balance sheets) for all the years. Discuss your findings. Show all
Step by Step Solution
There are 3 Steps involved in it

Get step-by-step solutions from verified subject matter experts