

Question: 3rd year, Operations & Production Planning Question: (I am asking this question again because the last chegg expert did not do it correctly) Please use
3rd year, Operations & Production Planning Question: (I am asking this question again because the last chegg expert did not do it correctly)
Please use the info. below and Excel SOLVER, to come up with the most optimal aggregate Production plan via EXCEL.
you may need to set up constraints
| Costs | |
| Regular Time Labour | 15 |
| Overtime Labour | 22 |
| Subcontracting cost (per unit) | 74 |
| Inventory carrying cost (per unit per month) | 3 |
| Material cost (per unit) | 40 |
| Selling Price (per unit) | 125 |
| Hiring Cost (per new employee) | 1000 |
| Lay-off cost (per laid off employee) | 2000 |
| Starting Inventory | 5000 |
| Desired Ending Inventory | 5000 |
| Overtime Limit (number of units produced per employee) | 10 |
| Production Capacity (per employee per month) | 80 units |
| Starting Workforce | 250 workers |
| Labour hours per unit | 2 |
| MAX overtime per month per employee, HOURS | 20 |
| # of working days per month | 20 |
| # of hours per day | 8 |
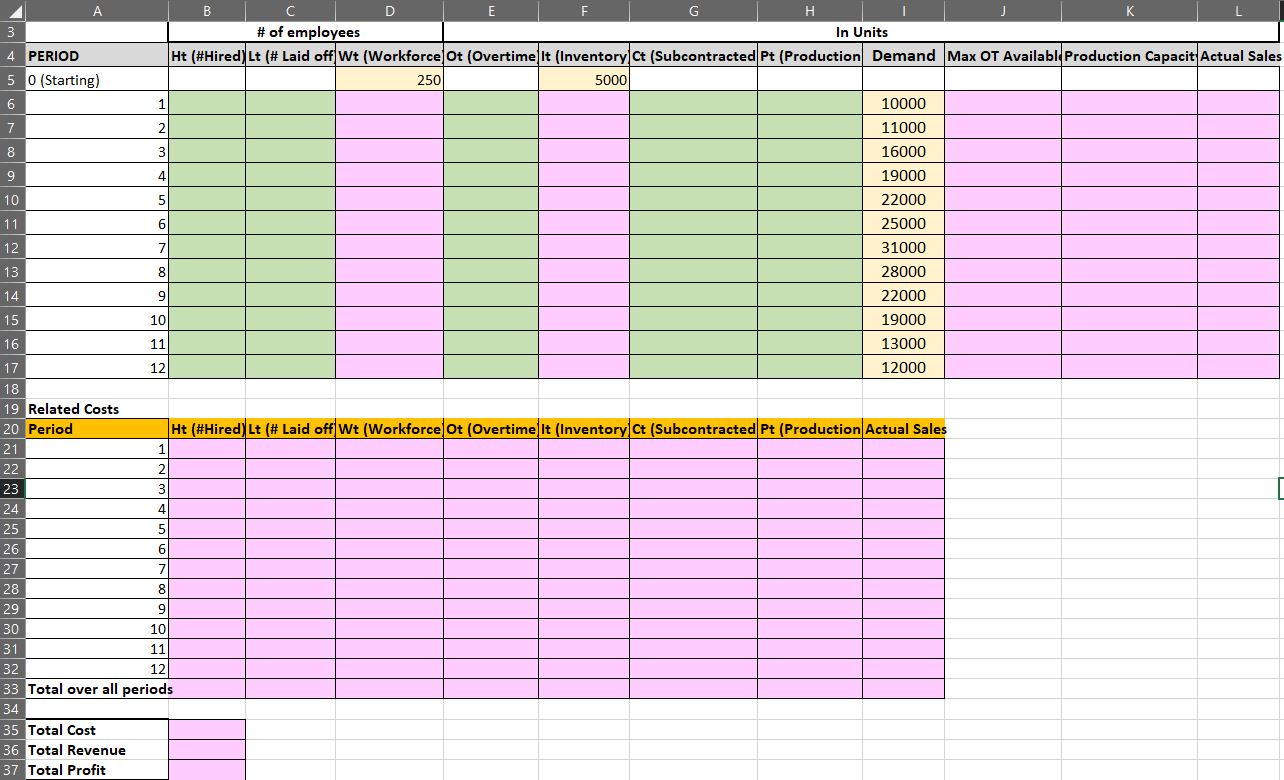
4 PERIOD 5 0 (Starting) 6 B D H # of employees In Units Ht (#Hired) Lt (# Laid off Wt (Workforce Ot (Overtime It (Inventory Ct (Subcontracted Pt (Production Demand Max OT Available Production Capacit Actual Sales 5000 1 10000 11000 250 7 2 8 3 16000 9 4 19000 10 5 22000 11 6 25000 12 7 31000 13 8 28000 14 9 22000 15 10 19000 16 11 13000 17 12 12000 18 19 Related Costs 20 Period Ht (#Hired) Lt (# Laid off Wt (Workforce Ot (Overtime It (Inventory Ct (Subcontracted Pt (Production Actual Sales 21 22 2 23 3 24 4 25 5 26 6 27 7 28 8 29 9 30 10 31 11 32 12 33 Total over all periods 34 35 Total Cost 36 Total Revenue 37 Total Profit 4 PERIOD 5 0 (Starting) 6 B D H # of employees In Units Ht (#Hired) Lt (# Laid off Wt (Workforce Ot (Overtime It (Inventory Ct (Subcontracted Pt (Production Demand Max OT Available Production Capacit Actual Sales 5000 1 10000 11000 250 7 2 8 3 16000 9 4 19000 10 5 22000 11 6 25000 12 7 31000 13 8 28000 14 9 22000 15 10 19000 16 11 13000 17 12 12000 18 19 Related Costs 20 Period Ht (#Hired) Lt (# Laid off Wt (Workforce Ot (Overtime It (Inventory Ct (Subcontracted Pt (Production Actual Sales 21 22 2 23 3 24 4 25 5 26 6 27 7 28 8 29 9 30 10 31 11 32 12 33 Total over all periods 34 35 Total Cost 36 Total Revenue 37 Total Profit
Step by Step Solution
There are 3 Steps involved in it

Get step-by-step solutions from verified subject matter experts