

Question: (3).T P5.3 (similar to) Assume you are considering a portfolio containing two assets, L and M. Asset L will represent 45% of the dollar value


![The projected portfolio retum, , for 2010 is ]%. (Round to two](https://s3.amazonaws.com/si.experts.images/answers/2024/06/6662154ef0f99_0146662154ed898a.jpg)
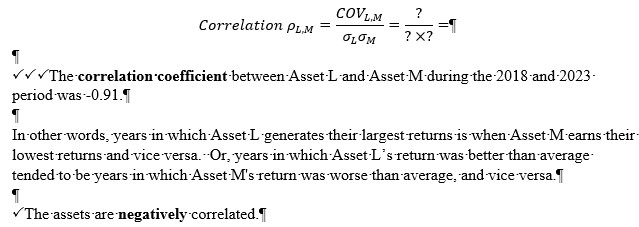
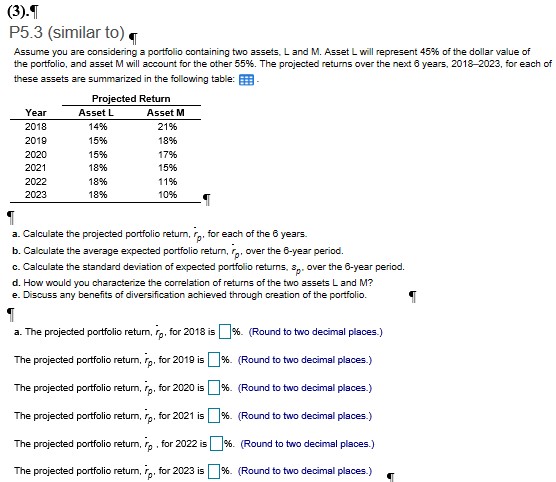
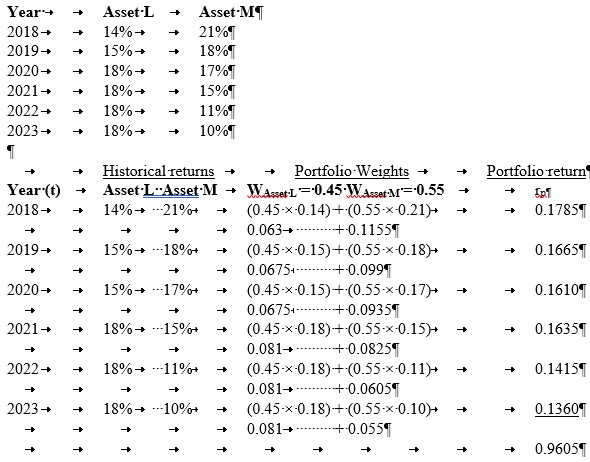
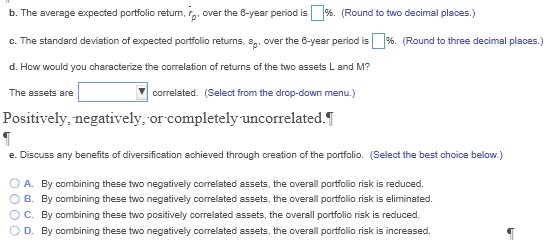
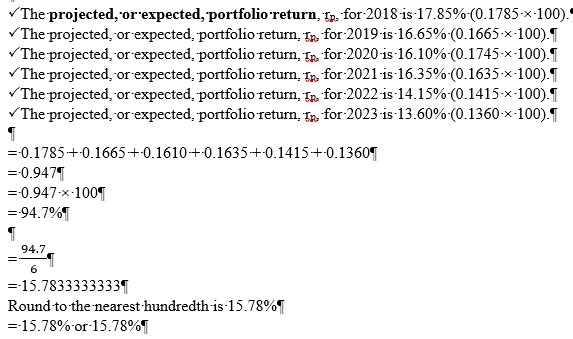
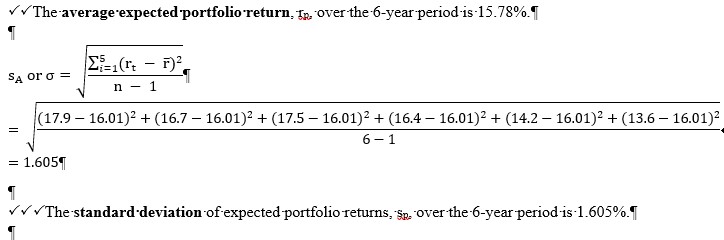
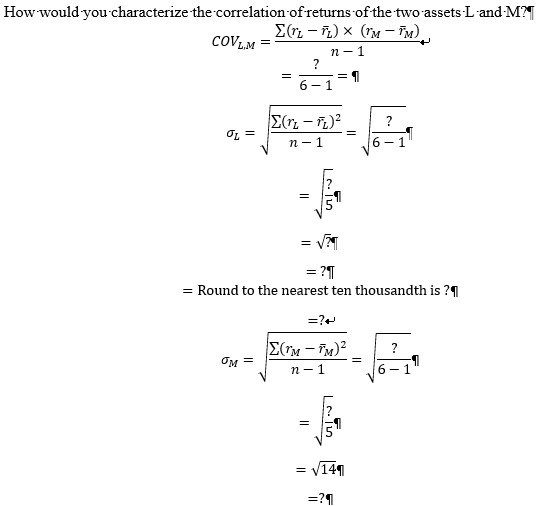
(3).T P5.3 (similar to) Assume you are considering a portfolio containing two assets, L and M. Asset L will represent 45% of the dollar value of the portfolio, and asset M will account for the other 559%. The projected returns over the next 6 years, 2018-2023, for each of these assets are summarized in the following table: [1 - Projected Return Year Asset L Asset M 2018 14% 219% 2019 15% 189% 2020 15% 179% 2021 18% 159% 2022 18% 119% 2023 18% 10% a. Calculate the projected portfolio retum, ro. for each of the 6 years. b. Calculate the average expected portfolio retum, for over the 6-year period. c. Calculate the standard deviation of expected portfolio returns. s,. over the 6-year period. d. How would you characterize the correlation of returns of the two assets L and M? e. Discuss any benefits of diversification achieved through creation of the portfolio. a. The projected portfolio retum, ro, for 2018 is | 6. (Round to two decimal places.) The projected portfolio retum, , for 2010 is ]%. (Round to two decimal places.) The projected portfolio retum, p. for 2020 is |%. (Round to two decimal places.) The projected portfolio retum, p. for 2021 is |%. (Round to two decimal places.) The projected portfolio retum, 7 . for 2022 is 6. (Round to two decimal places.) The projected portfolio return, 7, , for 2023 is | 6. (Round to two decimal places.)b. The average expected portfolio return, ro, over the 0-year period is %. (Round to two decimal places.) c. The standard deviation of expected portfolio returns. s, , over the 6-year period is 9%. (Round to three decimal places.) d. How would you characterize the correlation of returns of the two assets L and M? The assets are correlated. (Select from the drop-down menu.) Positively, negatively, or completely uncorrelated. f e. Discuss any benefits of diversification achieved through creation of the portfolio. (Select the best choice below.) O A. By combining these two negatively correlated assets, the overall portfolio risk is reduced. O B. By combining these two negatively correlated assets, the overall portfolio risk is eliminated. O C. By combining these two positively correlated assets, the overall portfolio risk is reduced. O D. By combining these two negatively correlated assets, the overall portfolio risk is increased.Year + + Asset.L Asset-MIT 2018- -+ 14%-+ -+ 21%T 2019- 15%+ + 18%% 2020- 18% -+ 17%% 2021 - -+ 18% -+ + 15%T 2022-+ 18% + 11%7 2023 -+ 18% - 10% Historical returns + - Portfolio Weights + Portfolio return Year (t) Asset.L-Asset.M -+ WAsset-L --0.45.WAsset-M'=.0.55 -+ 2018- 14% - ---21%+ -+ (0.45-x-0.14)-+ (0.55 x-0.21)+ 0.17851 -+ 0.063-+ ......... +0.11551 2019- + 15%- ---18%+ (0.45.*-0.15)-+ (0.55 x-0.18)+ 0.16659 0.06754-........ + 0.0997 2020 - 15% + ---17%+ (0.45.x-0.15)-+ (0.55 x-0.17)+ 0.16109 + + 0.0675+-. .......+0.09351 2021 -+ + 18%- ---15%+ + (0.45-x-0.18)-+ (0.55 x -0.15)+ 0.16357 + -+ 0.081- -....... + 0.08259 2022- + 18%- ---11%+ + (0.45 x -0.18)-+ (0.55 x 0.11)+ 0.14159 -+ 0.081- -........ + 0.06057 2023 + + 18% - ---10%+ (0.45 x -0.18)-+ (0.55 x 0.10)+ 0.13609 + -+ 0.081- -.......+ 0.0551 0.96051The projected, or expected, portfolio return, to for 2018 is-17.85% (0.1785 x-100). The projected, or expected, portfolio return, In for-2019-is-16.65% (0.1665 x-100).T The projected, or expected, portfolio return, In for-2020-is-16.10% (0.1745 x -100).T The projected, or expected, portfolio return, In for-2021 is-16.35% (0.1635.x-100).1 The projected, or expected, portfolio return, In for-2022-is-14.15% (0.1415 x-100).f The projected, or expected, portfolio return, In for-2023-is-13.60% (0.1360 x-100).T =0.1785 + 0.1665 +-0.1610 + 0.1635 + 0.1415 +-0.1360 =0.9471 =0.947.x -100 =-94.7% 94.7 6 =-15.78333333331 Round to the nearest hundredth is-15.78% =-15.78%-or-15.78%v v The average expected portfolio return, In over the 6-year period-is-15.78%.J SA Or O = En(r - F)2 n - 1 (17.9 - 16.01)2 + (16.7 -16.01)2+ (17.5 - 16.01)2+ (16.4 -16.01)2 + (14.2 -16.01)2 + (13.6 -16.01) 6-1 = 1.6051 The standard deviation of expected portfolio returns, $p over the-6-year period is-1.605%.JHow would you characterize the correlation of returns of the two assets L and M?T COVAM = E(n - ) X (I'M - FM) ? n - 1 = 6-1 E(n - 12)2 ? O = n - 1 6 1 = VN = 71 = Round to the nearest ten thousandth is ?9 OM = E(TM - FM)2 n - 1 6 = uil-4 1 = V141 Correlation PLM COVLM = OLUM ? X? The correlation coefficient-between-Asset-L and Asset-M-during the-2018-and-2023- period was--0.91.T In other words, years in which Asset-L generates their largest returns is when Asset-M-earns their lowest returns and vice versa.-Or, years in which Asset-L's return was better than average. tended to be years in which Asset-M's return was worse than average, and vice versa. The assets are negatively correlated. T
Step by Step Solution
There are 3 Steps involved in it

Get step-by-step solutions from verified subject matter experts