

Question: 4. Refer to Problem 3. Calculate the average expected return and standard deviation over the six-year period if asset L represents 50% of the portfolio
4. Refer to Problem 3. Calculate the average expected return and standard deviation over the six-year period if asset L represents 50% of the portfolio and asset M represents the other 50%. Which form of this portfolio is the best compared to the answers from Problem 3?
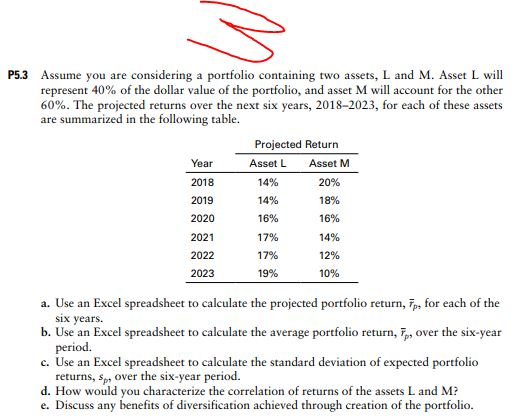
P53 Assume you are considering a portfolio containing two assets, L and M. Asset L will represent 40% of the dollar value of the portfolio, and asset M will account for the other 60%. The projected returns over the next six years, 2018-2023, for each of these assets are summarized in the following table. Projected Return Year 2018 2019 2020 2021 2022 2023 Asset L 14% 14% 16% 17% 17% 19% Asset M 20% 18% 16% 14% 12% 10% a. Use an Excel spreadsheet to calculate the projected portfolio return, for each of the six years. b. Use an Excel spreadsheet to calculate the average portfolio return, 7p, over the six-year period. c. Use an Excel spreadsheet to calculate the standard deviation of expected portfolio returns, sp, over the six-year period. d. How would you characterize the correlation of returns of the assets L and M? e. Discuss any benefits of diversification achieved through creation of the portfolio
Step by Step Solution
There are 3 Steps involved in it

Get step-by-step solutions from verified subject matter experts