

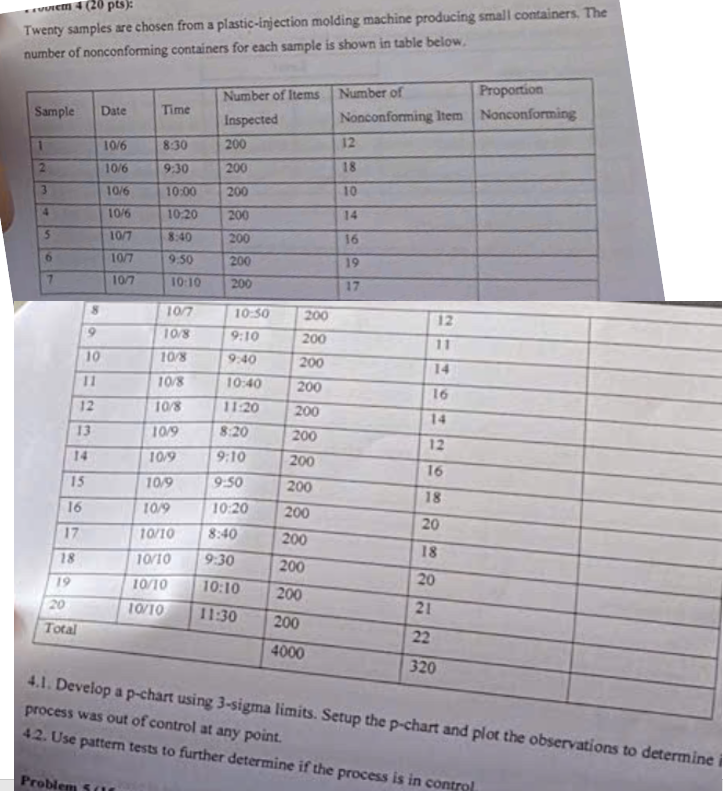
Question: 4 . 1 . Develop a p - chart using 3 - sigma limits . Setup the p - chart and plot the observations to
Develop a pchart using sigma limits Setup the pchart and plot the observations to determine process was out of control at any point.
Use pattern tests to further determine if the process is in control.
Step by Step Solution
There are 3 Steps involved in it
1 Expert Approved Answer
Step: 1 Unlock

Question Has Been Solved by an Expert!
Get step-by-step solutions from verified subject matter experts
Step: 2 Unlock
Step: 3 Unlock