

Question: 4. [15 Points] The table below shows the increase in average monthly price for cable television in the United States since the year 2012. (a)
![4. [15 Points] The table below shows the increase in average](https://s3.amazonaws.com/si.experts.images/answers/2024/06/6673b0bd5aa0c_9176673b0bd3c6c9.jpg)
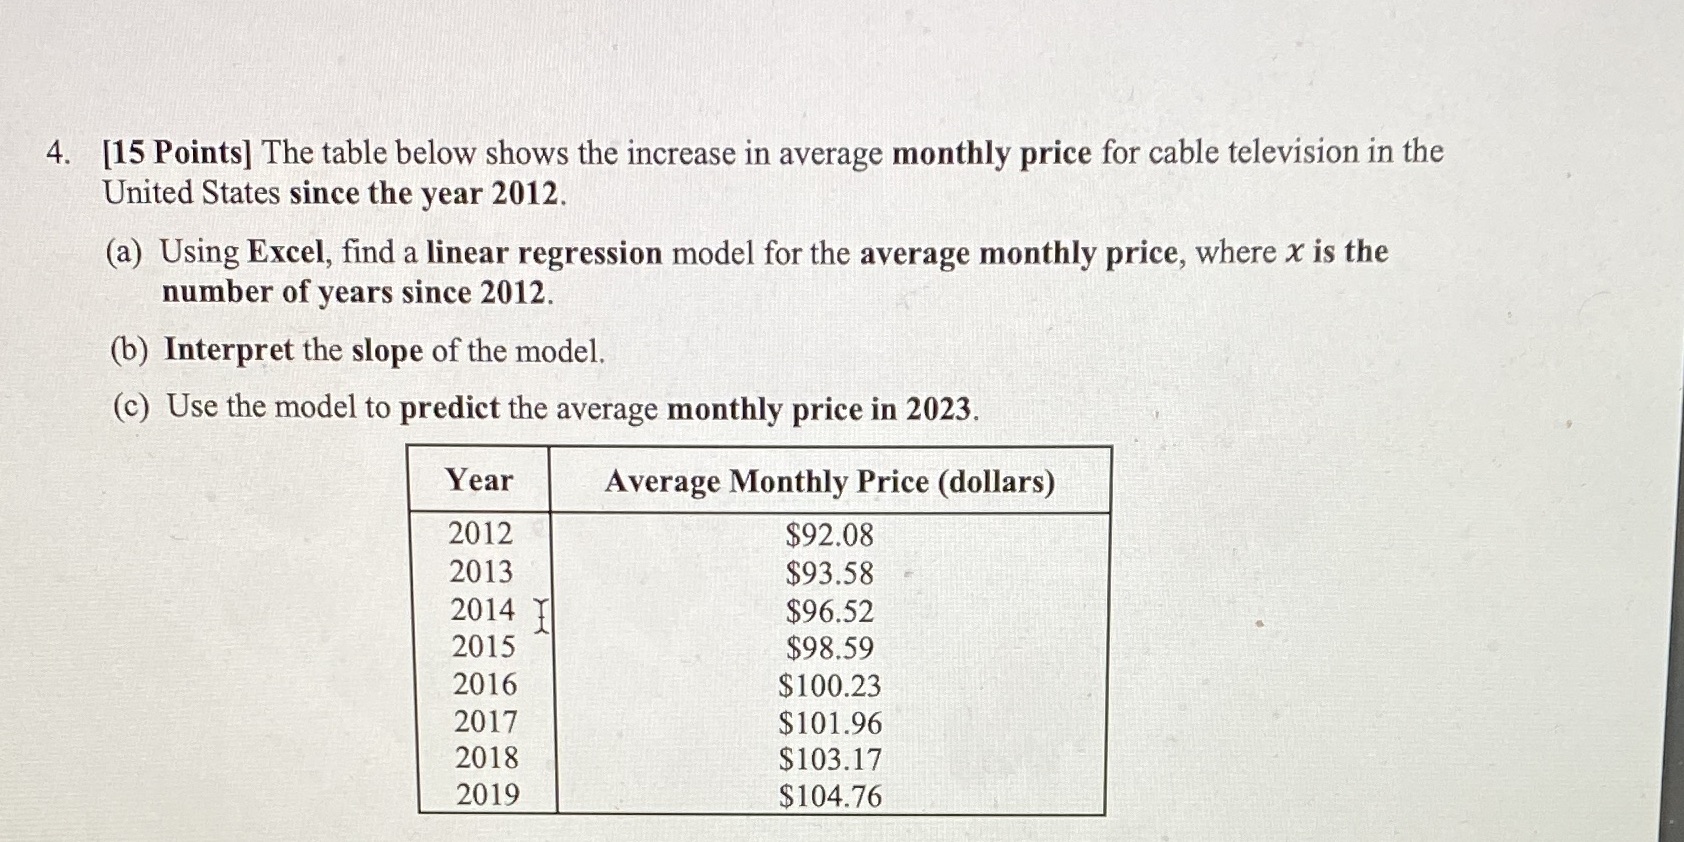
4. [15 Points] The table below shows the increase in average monthly price for cable television in the United States since the year 2012. (a) Using Excel, find a linear regression model for the average monthly price, where x is the number of years since 2012. (b) Interpret the slope of the model. (c) Use the model to predict the average monthly price in 2023. Year Average Monthly Price (dollars) 2012 $92.08 2013 $93.58 2014 $96.52 2015 $98.59 2016 $100.23 2017 $101.96 2018 $103.17 2019 $104.76
Step by Step Solution
There are 3 Steps involved in it
1 Expert Approved Answer
Step: 1 Unlock

Question Has Been Solved by an Expert!
Get step-by-step solutions from verified subject matter experts
Step: 2 Unlock
Step: 3 Unlock