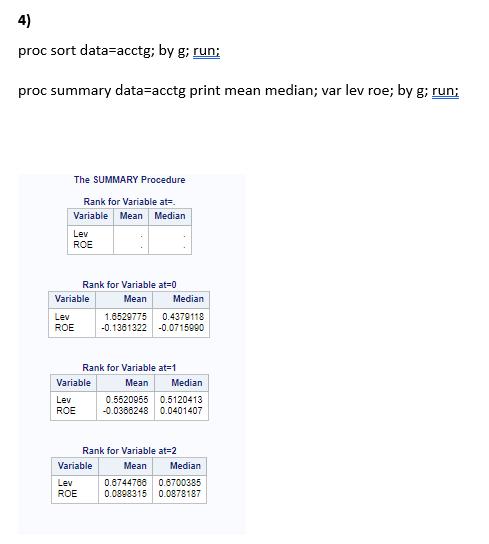
4. (3 points) Report the mean and median of total assets, leverage and return on equity...
Fantastic news! We've Found the answer you've been seeking!
Question:
![4. (3 points) Report the mean and median of total assets, leverage and return on equity by size group (show](https://dsd5zvtm8ll6.cloudfront.net/si.experts.images/questions/2023/05/6475ca4c0444d_1685441098795.jpg)
![4) proc sort data=acctg; by g; run; proc summary data=acctg print mean median; var lev roe; by g; run; The](https://dsd5zvtm8ll6.cloudfront.net/si.experts.images/questions/2023/05/6475ca5300b1c_1685441105722.jpg)
Transcribed Image Text:
4. (3 points) Report the mean and median of total assets, leverage and return on equity by size group (show both SAS codes and results). Briefly comment on what you observe. 4) proc sort data=acctg; by g; run; proc summary data=acctg print mean median; var lev roe; by g; run; The SUMMARY Procedure Rank for Variable at=. Variable Mean Median Lev ROE Rank for Variable at=0 Mean Variable Lev ROE Rank for Variable at=1 Mean Variable Lev ROE Median 1.6529775 0.4379118 -0.1381322 -0.0715990 Variable Lev ROE Median 0.5520955 0.5120413 -0.0386248 0.0401407 Rank for Variable at=2 Mean Median 0.8744788 0.6700385 0.0898315 0.0878187 4. (3 points) Report the mean and median of total assets, leverage and return on equity by size group (show both SAS codes and results). Briefly comment on what you observe. 4) proc sort data=acctg; by g; run; proc summary data=acctg print mean median; var lev roe; by g; run; The SUMMARY Procedure Rank for Variable at=. Variable Mean Median Lev ROE Rank for Variable at=0 Mean Variable Lev ROE Rank for Variable at=1 Mean Variable Lev ROE Median 1.6529775 0.4379118 -0.1381322 -0.0715990 Variable Lev ROE Median 0.5520955 0.5120413 -0.0386248 0.0401407 Rank for Variable at=2 Mean Median 0.8744788 0.6700385 0.0898315 0.0878187
Expert Answer:
Answer rating: 100% (QA)
Youve presented SAS code and the output from a statistical analysis showing the mean and median of total assets leverage and return on equity by size ... View the full answer
Related Book For
Introductory Statistics Exploring The World Through Data
ISBN: 9780321978271
2nd Edition
Authors: Robert Gould, Colleen Ryan
Posted Date:
Students also viewed these finance questions
-
For the most recent period, Ayayai Company earned sales of $164000 and a gross margin of $52070. If the selling price per unit was $4, what is the product cost per unit?
-
Read the case study "Southwest Airlines," found in Part 2 of your textbook. Review the "Guide to Case Analysis" found on pp. CA1 - CA11 of your textbook. (This guide follows the last case in the...
-
Planning is one of the most important management functions in any business. A front office managers first step in planning should involve determine the departments goals. Planning also includes...
-
How to respond to the following? Cycle stock, pipeline inventory, buffer stock, and in-transit inventory all have associated carrying costs. Interest rates on inventory values, warehousing expenses,...
-
How have total output and output per worker changed over time in Canada? How have these changes affected the lives of typical Canadians?
-
What are the two ways a party may obtain a voluntary dismissal of an action?
-
Learn about the basic theories and models that contribute to strategic marketing management in the fashion industry. LO.1
-
Richard, age 35, owns an ordinary life insurance policy in the amount of $250,000. The policy is a participating policy that pays dividends. Richard has a number of financial goals and objectives....
-
Production company Puupaat Oy has come up with a notion for a new television serial. Developing the notion into a concept would cost e 1.5m. New concepts have an equal chance of being either good or...
-
Lime's business has had liquidity problems for some months. The following trial balance was extracted from his books of account as at 30 September 2012: Additional information: 1. Stock at 30...
-
how do you figure the overhead rate? ch.9 pg. 509 & 510 thanks!
-
You are an external auditor in a firm that undertakes the audit of Canadian Life and Mutual (CLM), a large, Montreal-based financial institution. CLM relies heavily on its computer-based information...
-
You need to temporarily increase the feed rate to an existing column without flooding. Since the column is now operating at about \(90 \%\) of flooding, you must vary some operating parameter. The...
-
Consider, again, the clothing data set. Obtain the three summary plots of the sample cross-correlations for lags 1 to 21.
-
Based on the dangling-else discussion in Exercise 3.27, modify the following code to produce the output shown. Use proper indentation techniques. You must not make any additional changes other than...
-
Consider the random process \(U(t)=A\), where \(A\) is a random variable uniformly distributed on \((-1,1)\). (a) Sketch some sample functions of this process. (b) Find the time autocorrelation...
-
SU E Styles (Prepared from a situation suggested by Professor John W. Hardy.) Lone Star Meat Packers is a major processor of beef and other meat products. The company has a large amount of T-bone...
-
A random sample of 10 houses heated with natural gas in a particular area, is selected, and the amount of gas (in therms) used during the month of January is determined for each house. The resulting...
-
For each of the following, state whether a one-proportion z-test or a two-proportion z-test would be appropriate, and name the populations. a. A student watches a random sample of men and women...
-
The table gives information on college majors at Wellesley College, a women's college outside of Boston. Sketch an appropriate graph of the distribution, and comment on its important features. Major...
-
The figure shows side-by-side boxplots of the number of hours per week that UCLA students spent listening to music. Minitab output for ANOVA is also shown. Check whether the conditions for ANOVA...
-
Compare your results for the hypothesis test and the confidence interval. Comment.
-
Assume normality. Construct a 90% confidence interval for the population correlation coefficient. Interpret the result.
-
Calculate the correlation coefficient r.
![Mobile App Logo](https://dsd5zvtm8ll6.cloudfront.net/includes/images/mobile/finalLogo.png)
Study smarter with the SolutionInn App