

Question: 4-. [30 marks) Consider the equilibrium in a monopolistically competitive market depicted in Figure 2. Cost. Cand F'rlce. P Number of rms. 1'} Figure 2.
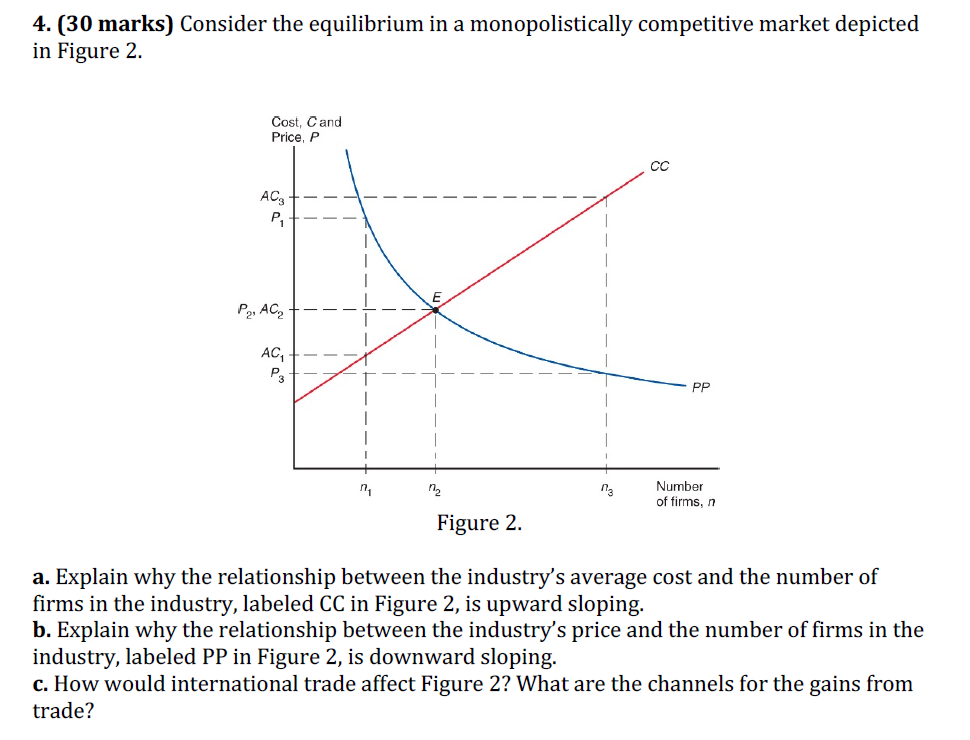

4-. [30 marks) Consider the equilibrium in a monopolistically competitive market depicted in Figure 2. Cost. Cand F'rlce. P Number of rms. 1'} Figure 2. :1. Explain why the relationship between the industry' s average cost and the number of rms in the industry, labeled CC in Figure 2, is upward sloping. b. Explain why the relationship between the industry' s price and the number of rms in the industry, labeled PP in Figure 2, is downward sloping. c. How would international trade affect Figure 2? What are the channels for the gains from trade
Step by Step Solution
There are 3 Steps involved in it
1 Expert Approved Answer
Step: 1 Unlock

Question Has Been Solved by an Expert!
Get step-by-step solutions from verified subject matter experts
Step: 2 Unlock
Step: 3 Unlock