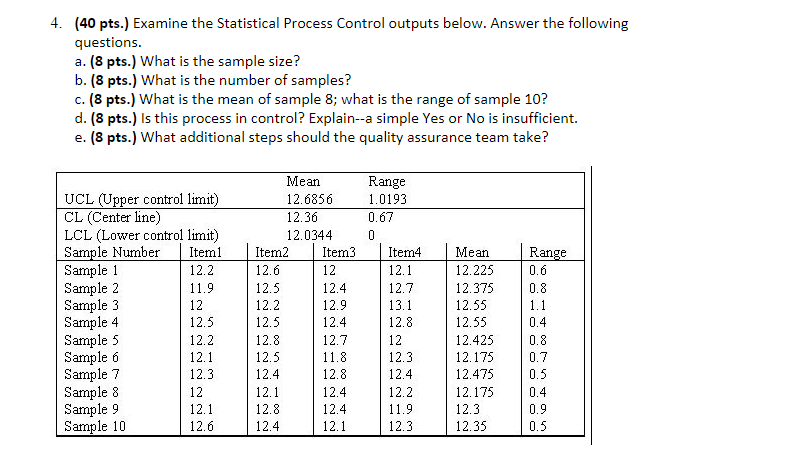
Question: 4. (40 pts.) Examine the Statistical Process Control outputs below. Answer the following questions. a. (8 pts.) What is the sample size? b. (8 pts.)

4. (40 pts.) Examine the Statistical Process

4. (40 pts.) Examine the Statistical Process Control outputs below. Answer the following questions. a. (8 pts.) What is the sample size? b. (8 pts.) What is the number of samples? c. (8 pts.) What is the mean of sample 8; what is the range of sample 10? d. (8 pts.) Is this process in control? Explain--a simple Yes or No is insufficient. e. (8 pts.) What additional steps should the quality assurance team take? UCL (Upper control limit) CL (Center line) LCL (Lower control limit) Sample Number Item1 Sample 1 12.2 Sample 2 11.9 Sample 3 12 Sample 4 12.5 Sample 5 12.2 Sample 6 12.1 Sample 7 12.3 Sample 8 12 Sample 9 12.1 Sample 10 12.6 Mean 12.6856 12.36 12.0344 Item2 Item3 12.6 12 12.5 12.4 12.2 12.9 12.5 12.4 12.8 12.7 12.5 11.8 12.4 12.8 12.1 12.4 12.8 12.4 12.4 12.1 Range 1.0193 0.67 0 Item4 12.1 12.7 13.1 12.8 12 12.3 12.4 12.2 11.9 12.3 Mean 12.225 12.375 12.55 12.55 12.425 12.175 12.475 12.175 12.3 12.35 Range 0.6 0.8 1.1 0.4 0.8 0.7 0.5 0.4 0.9 0.5

Step by Step Solution

There are 3 Steps involved in it

1 Expert Approved Answer
Step: 1 Unlock blur-text-image
Question Has Been Solved by an Expert!

Get step-by-step solutions from verified subject matter experts

Step: 2 Unlock
Step: 3 Unlock

Students Have Also Explored These Related General Management Questions!