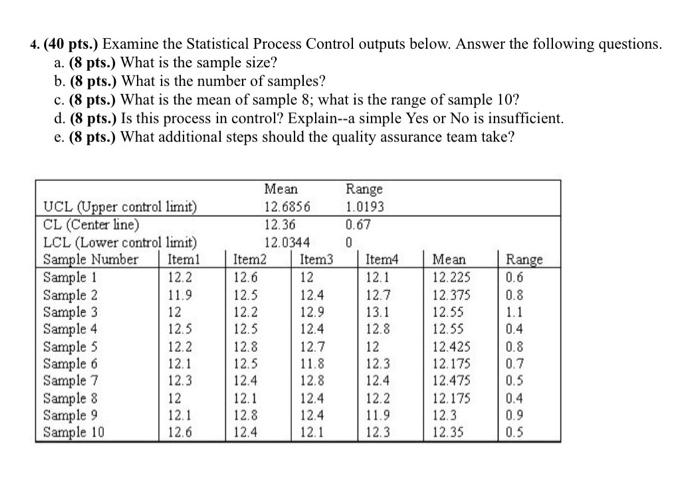
Question: please show steps and explanation 1. (46 pts. Assuming it is needed to check a process for whether In-Control or Out-of-Control hy developing control charts.

please show steps and explanation please show steps and explanation 1. (46 pts.
please show steps and explanation 1. (46 pts.
1. (46 pts. Assuming it is needed to check a process for whether In-Control or Out-of-Control hy developing control charts. After taking 20 samples with a size of 4 each from the process, below calculatices are received: a) (35 pts.) Calculate the control limits b) (spts.) Estimate the process mean and standard deviation. 2. (Multiple-Choice) (10 pts.) Ir-23 ounces, a = 0.4 ounces, and a 16, what will be the 130 control limits for the x-bar chart a) 21.8 to 24.2 ounces b) 23 ounces 22.70 to 23.30 ounces ) 22.25 to 23.75 ounces >22.90 0 23.10 ounces 3.(Multiple-Choice) (10 pts.) A manager wishes to build a 3-sigma range chart for a process. The sample size is five, the mean of sample means is 16.01, and the average range is 5.3. From Table 56.1, the appropriate value of D3 is, and D4 is 2.115. What are the UCL. and LCL, respectively, for this range chart? a) 33.9 and 112 33.9 and 0 c) 11.2 and 0 d) 6.3 and 31.91 and 0.11 4. (40 pts.) Examine the Statistical Process Control outputs below. Answer the following questions 28 pls.) What is the sample size! b. (8 pts.) What is the number of samples! C-18 pts.) What is the mean of samples, what is the range of sample 10% d. (ps.) Is this process in control? Explain--a simple Yes or No is insufficient c. (8 pts.) What additional steps should the quality assurance team take! Range 10193 0 UCL Uger controllimit) CL (Cetter hne) LCL (Lower controllimit) Sample Number Itemi Sample 122 Sample 2 Sample 12 Simple 4 Suples Sample Sample 123 Sample 12 Sample 121 Sample 10 Mean 126856 1238 120344 Item2 Item) 126 12 125 124 122 129 125 123 127 125 11 124 128 121 124 123 124 124 Hem 121 127 13.1 123 Range 0.6 0$ 11 04 125 124 122 121 Mean 12 225 12375 12.55 12.55 12425 12.175 12475 12.12 123 1235 123 124 122 11.9 123 0.7 05 0.4 09 05 121 4. (40 pts.) Examine the Statistical Process Control outputs below. Answer the following questions. a. (8 pts.) What is the sample size? b. (8 pts.) What is the number of samples? c. (8 pts.) What is the mean of sample 8; what is the range of sample 10? d. (8 pts.) Is this process in control? Explain--a simple Yes or No is insufficient. e. (8 pts.) What additional steps should the quality assurance team take? UCL (Upper control limit) CL (Center line) LCL (Lower control limit) Sample Number Item1 Sample 1 12.2 Sample 2 11.9 Sample 3 12 Sample 4 12.5 Sample 5 12.2 Sample 6 12.1 Sample 7 12.3 Sample 8 12 Sample 9 12.1 Sample 10 12.6 Mean 12.6856 12.36 12.0344 Item2 Item3 12.6 12 12.5 12.4 12.2 12.9 12.5 12.4 12.8 12.7 12.5 11.8 12.4 12.8 12.1 12.4 12.8 12.4 12.4 12.1 Range 1.0193 0.67 0 Item4 12.1 12.7 13.1 12.8 12 12.3 12.4 12.2 11.9 12.3 Mean 12.225 12.375 12.55 12.55 12.425 12.175 12.475 12.175 12.3 12.35 Range 0.6 0.8 1.1 0.4 0.8 0.7 0.5 0.4 0.9 0.5

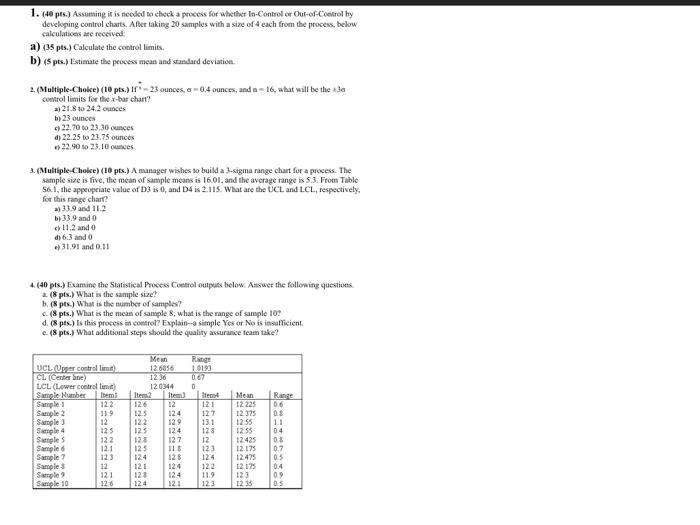
Step by Step Solution

There are 3 Steps involved in it

1 Expert Approved Answer
Step: 1 Unlock blur-text-image
Question Has Been Solved by an Expert!

Get step-by-step solutions from verified subject matter experts

Step: 2 Unlock
Step: 3 Unlock

Students Have Also Explored These Related General Management Questions!