

Question: # 4 ( 5 0 points ) The experimental open - loop frequency response plots for a system are shown. Approximate the transfer function that
# points
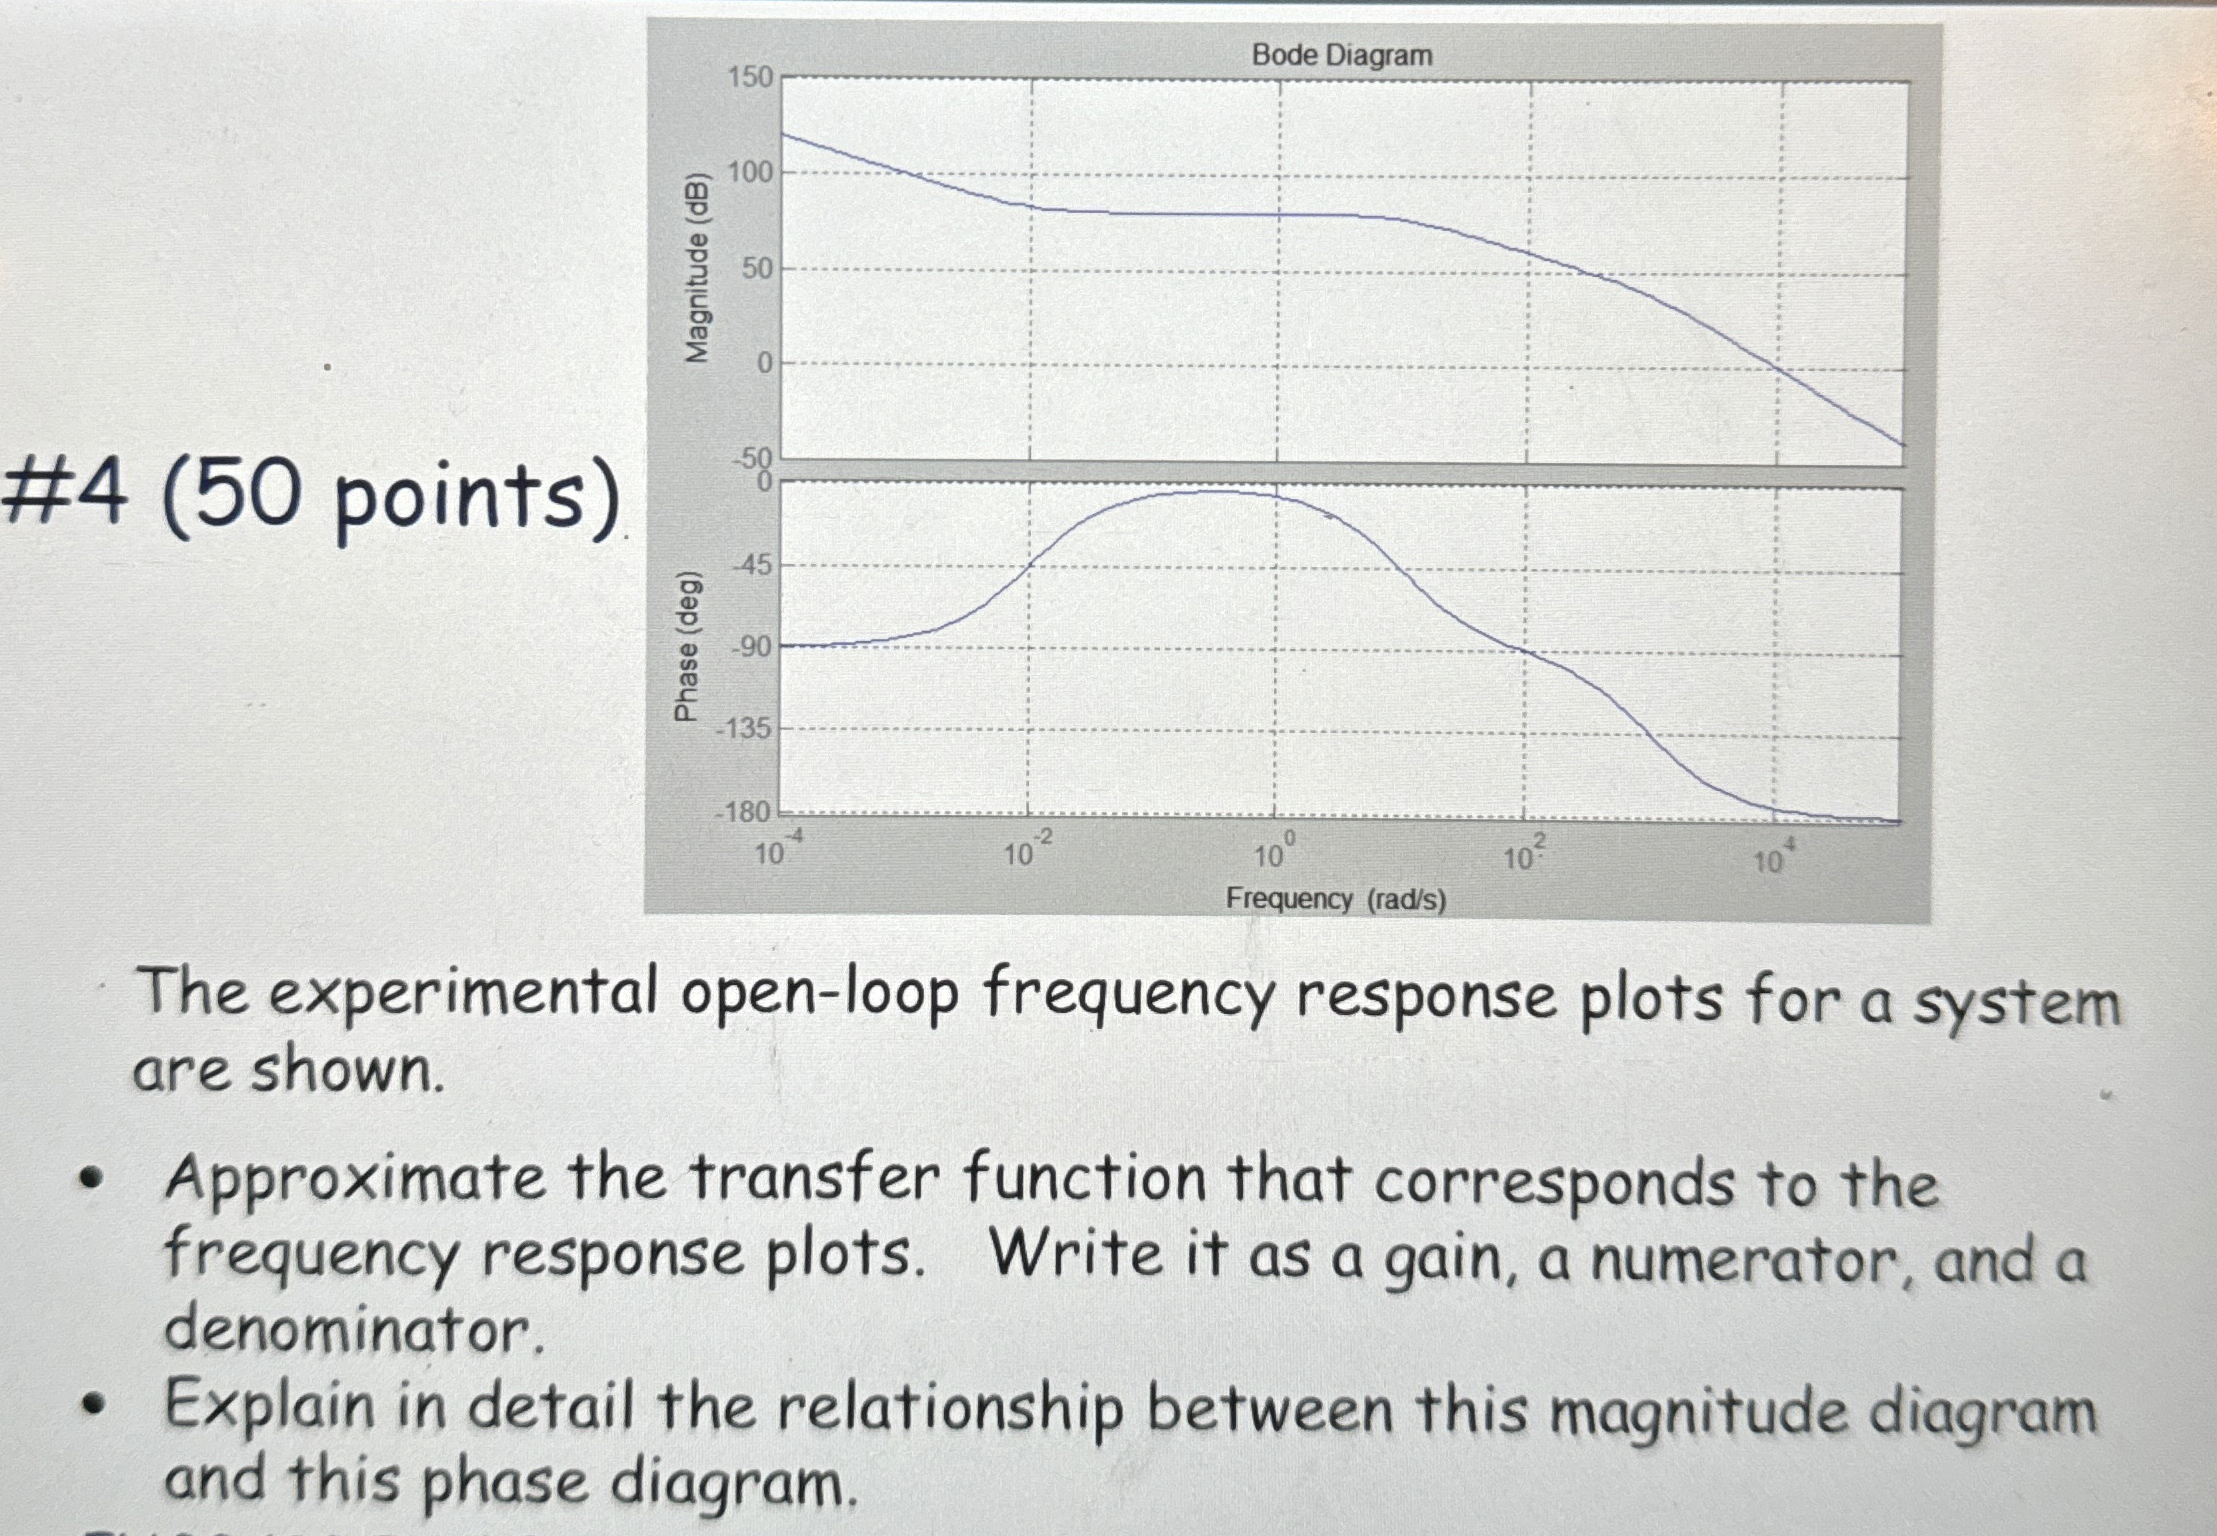
The experimental openloop frequency response plots for a system are shown.
Approximate the transfer function that corresponds to the frequency response plots. Write it as a gain, a numerator, and a denominator.
Explain in detail the relationship between this magnitude diagram and this phase diagram.
Step by Step Solution
There are 3 Steps involved in it
1 Expert Approved Answer
Step: 1 Unlock

Question Has Been Solved by an Expert!
Get step-by-step solutions from verified subject matter experts
Step: 2 Unlock
Step: 3 Unlock