

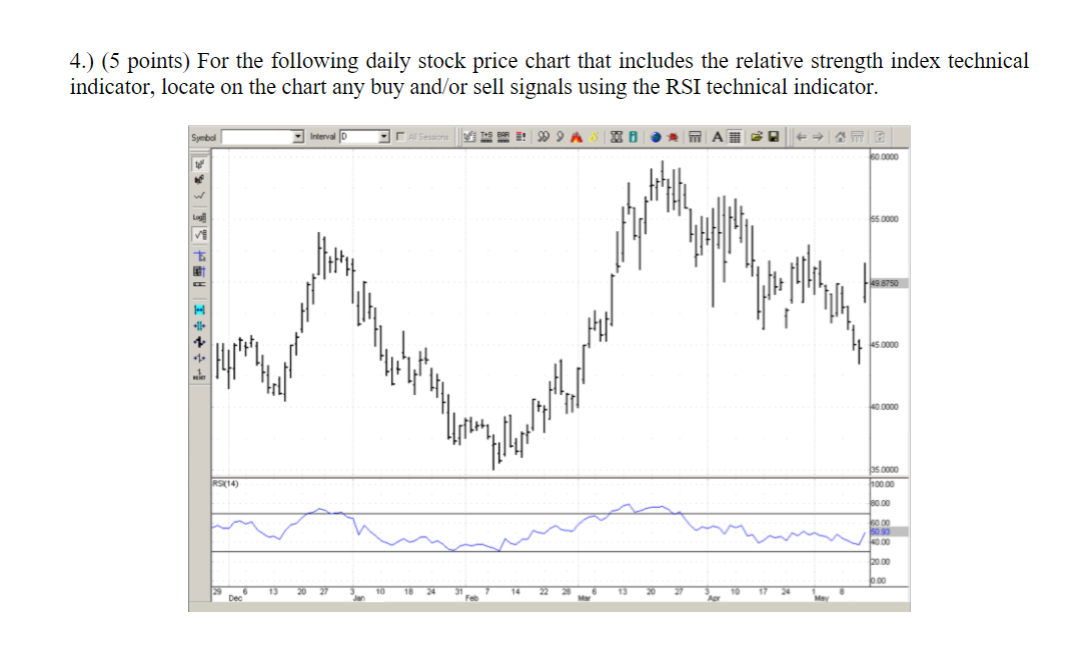
Question: 4 . ) ( 5 points ) For the following daily stock price chart that includes the relative strength index technical indicator, locate on the
points For the following daily stock price chart that includes the relative strength index technical indicator, locate on the chart any buy andor sell signals using the RSI technical indicator.
Step by Step Solution
There are 3 Steps involved in it
1 Expert Approved Answer
Step: 1 Unlock

Question Has Been Solved by an Expert!
Get step-by-step solutions from verified subject matter experts
Step: 2 Unlock
Step: 3 Unlock