

Question: 4 . 6 . 2 9 Water flows through the pipe contraction shown in Fig. P 4 . 6 . 2 9 . For the
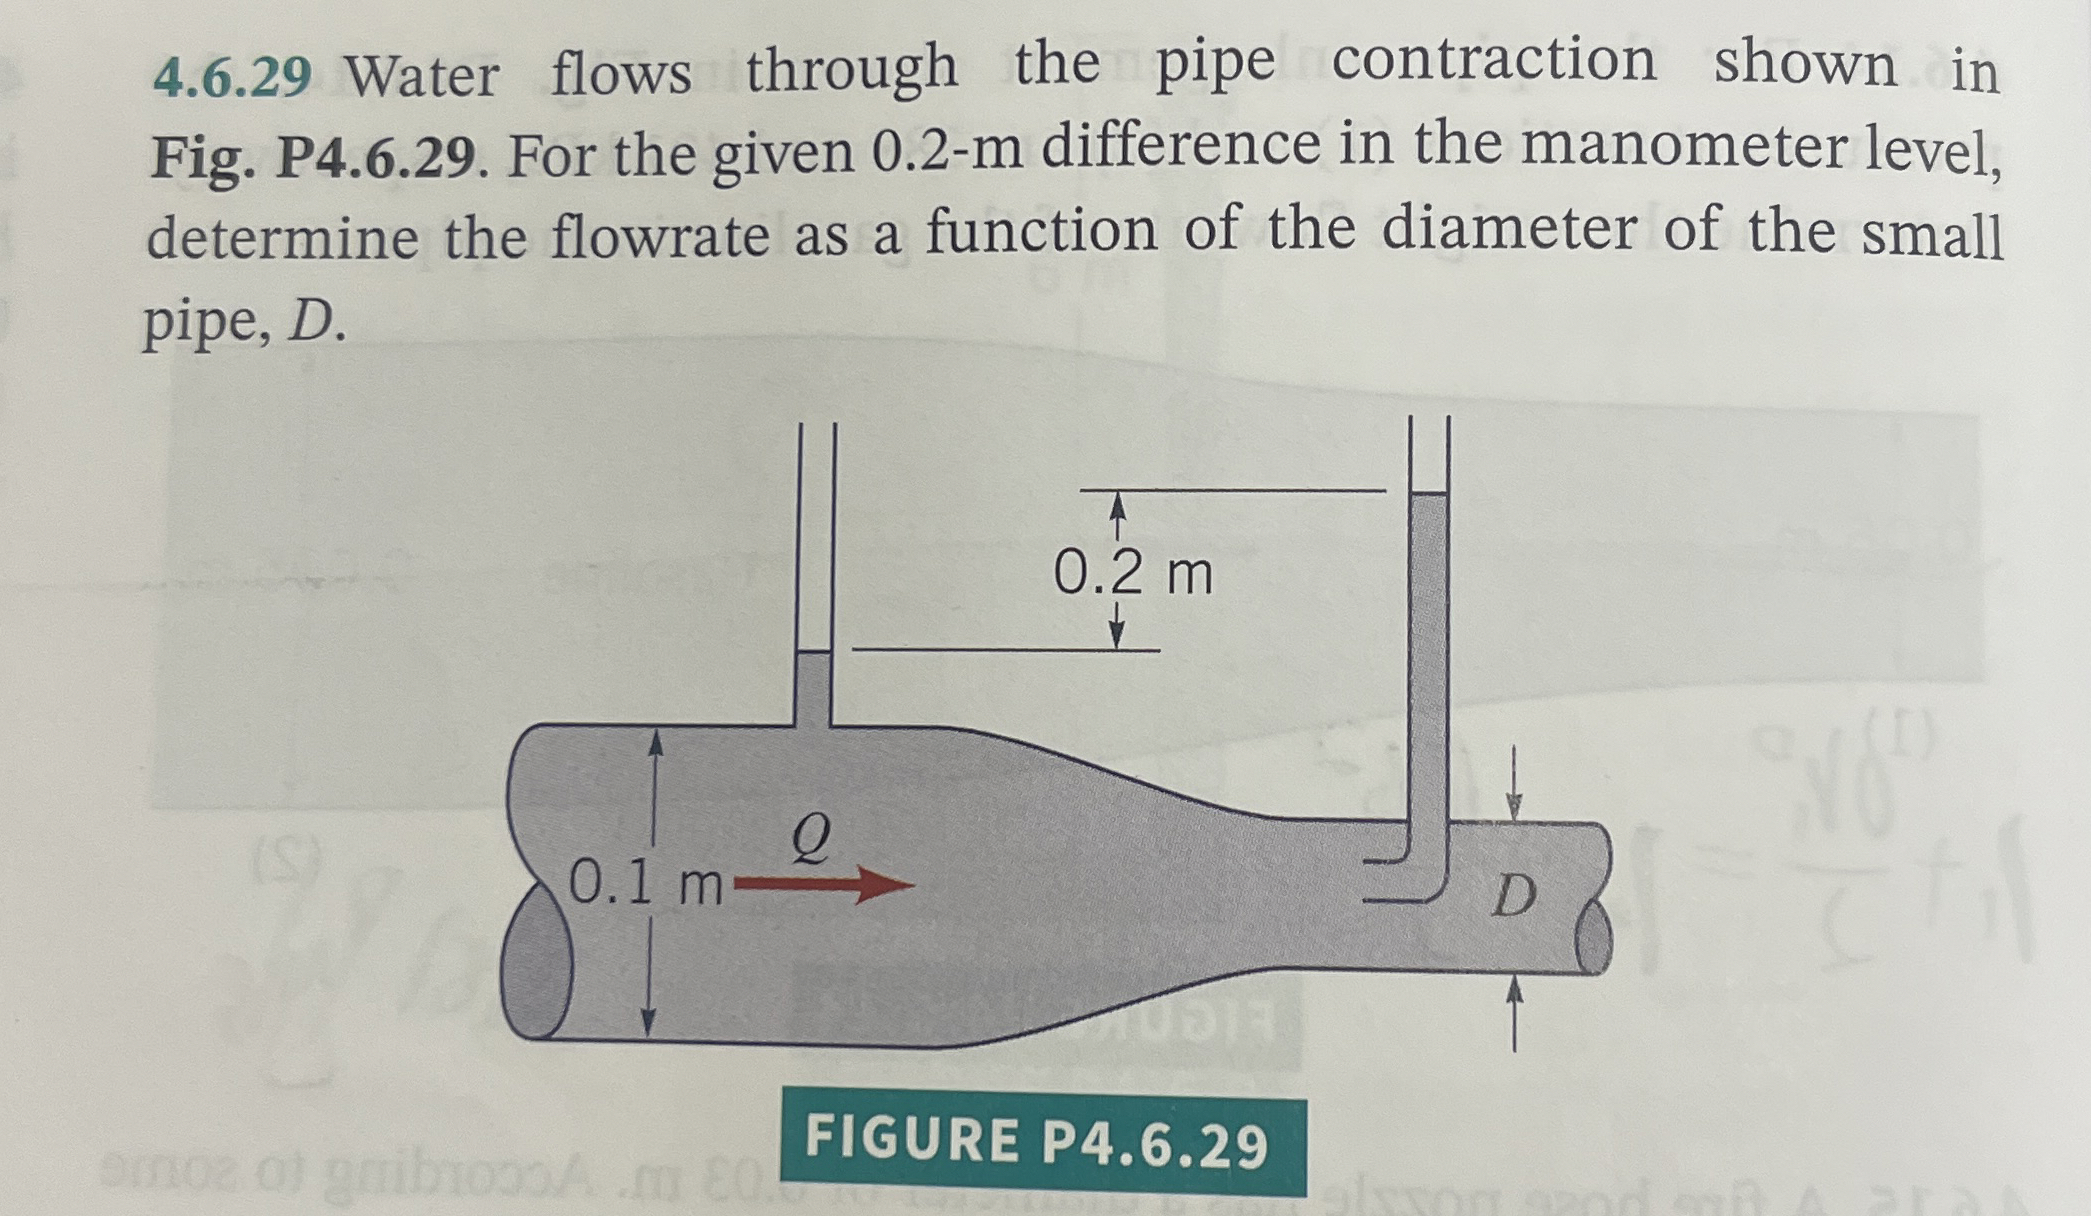
Water flows through the pipe contraction shown in Fig. P For the given m difference in the manometer level, determine the flowrate as a function of the diameter of the small pipe,
FIGURE P
Step by Step Solution
There are 3 Steps involved in it
1 Expert Approved Answer
Step: 1 Unlock

Question Has Been Solved by an Expert!
Get step-by-step solutions from verified subject matter experts
Step: 2 Unlock
Step: 3 Unlock