

Question: 4 - 6 Assuming that the data shown in Table 4 . 2 were collected on a rural road in your state and consideration is
Assuming that the data shown in Table were collected on a rural road in your state
and consideration is being made to set the speed limit on the road. Speed limits of
and are being considered. Plot the expected noncompliance percent
ages versus the associated speed limit on a graph and recommend the speed for the
road. Give reasons for your selection.
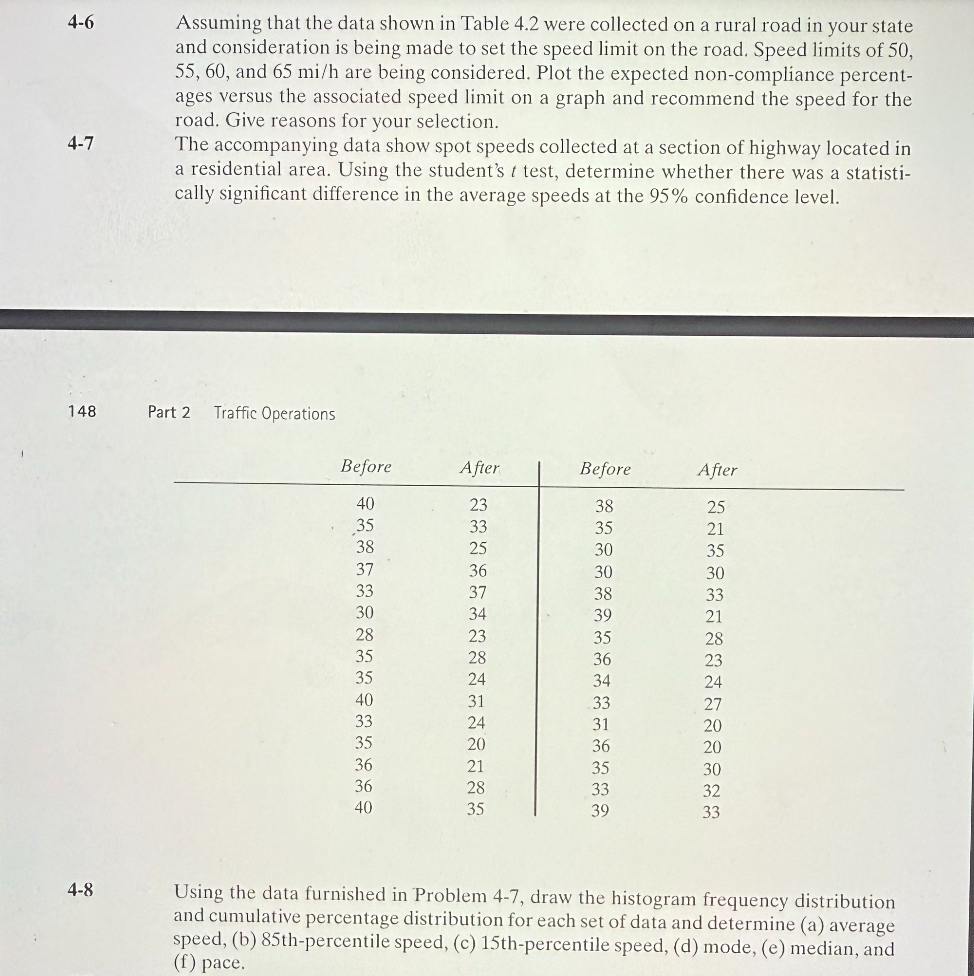
The accompanying data show spot speeds collected at a section of highway located in
a residential area. Using the student's test, determine whether there was a statisti
cally significant difference in the average speeds at the confidence level.
Using the data furnished in Problem draw the histogram frequency distribution
and cumulative percentage distribution for each set of data and determine a average
speed, bthpercentile speed, cthpercentile speed, d mode, e median, and
f pace.
Step by Step Solution
There are 3 Steps involved in it
1 Expert Approved Answer
Step: 1 Unlock

Question Has Been Solved by an Expert!
Get step-by-step solutions from verified subject matter experts
Step: 2 Unlock
Step: 3 Unlock