

Question: #4 a and b please show all work please and thank you 4. (36 points) The following information is given below about a project. Activity
#4 a and b please show all work please and thank you 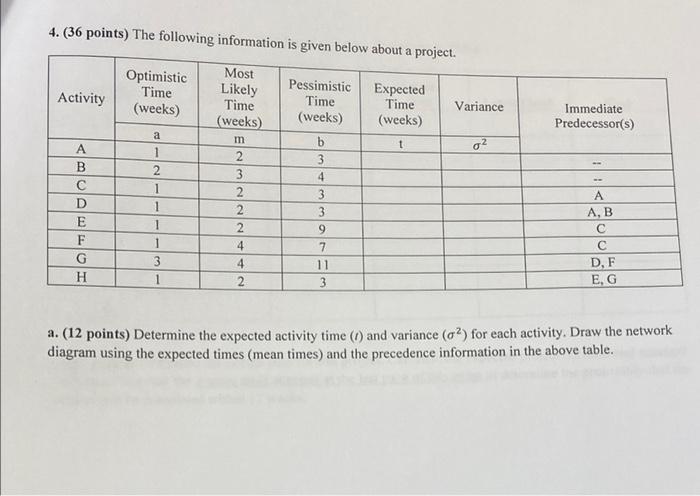
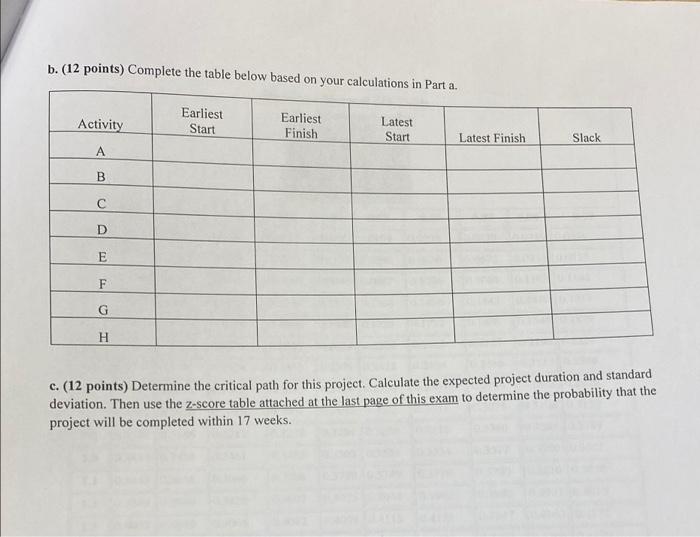
4. (36 points) The following information is given below about a project. Activity Optimistic Time (weeks) Pessimistic Time (weeks) Expected Time (weeks) Variance Most Likely Time (weeks) m 2 3 2 Immediate Predecessor(s) t g a 1 2 1 1 1 1 A B D E F G H 2 2 b 3 4 3 3 9 7 11 3 A AB DF E, G 3 1 4 4 2 a. (12 points) Determine the expected activity time () and variance (2) for each activity. Draw the network diagram using the expected times (mean times) and the precedence information in the above table. b. (12 points) Complete the table below based on your calculations in Parta. Activity Earliest Start Earliest Finish Latest Start Latest Finish Slack A B D E F G H c. (12 points) Determine the critical path for this project. Calculate the expected project duration and standard deviation. Then use the 2-score table attached at the last page of this exam to determine the probability that the project will be completed within 17 weeks
Step by Step Solution
There are 3 Steps involved in it
1 Expert Approved Answer
Step: 1 Unlock

Question Has Been Solved by an Expert!
Get step-by-step solutions from verified subject matter experts
Step: 2 Unlock
Step: 3 Unlock